Copyright
©The Author(s) 2020.
World J Radiol. May 28, 2020; 12(5): 76-86
Published online May 28, 2020. doi: 10.4329/wjr.v12.i5.76
Published online May 28, 2020. doi: 10.4329/wjr.v12.i5.76
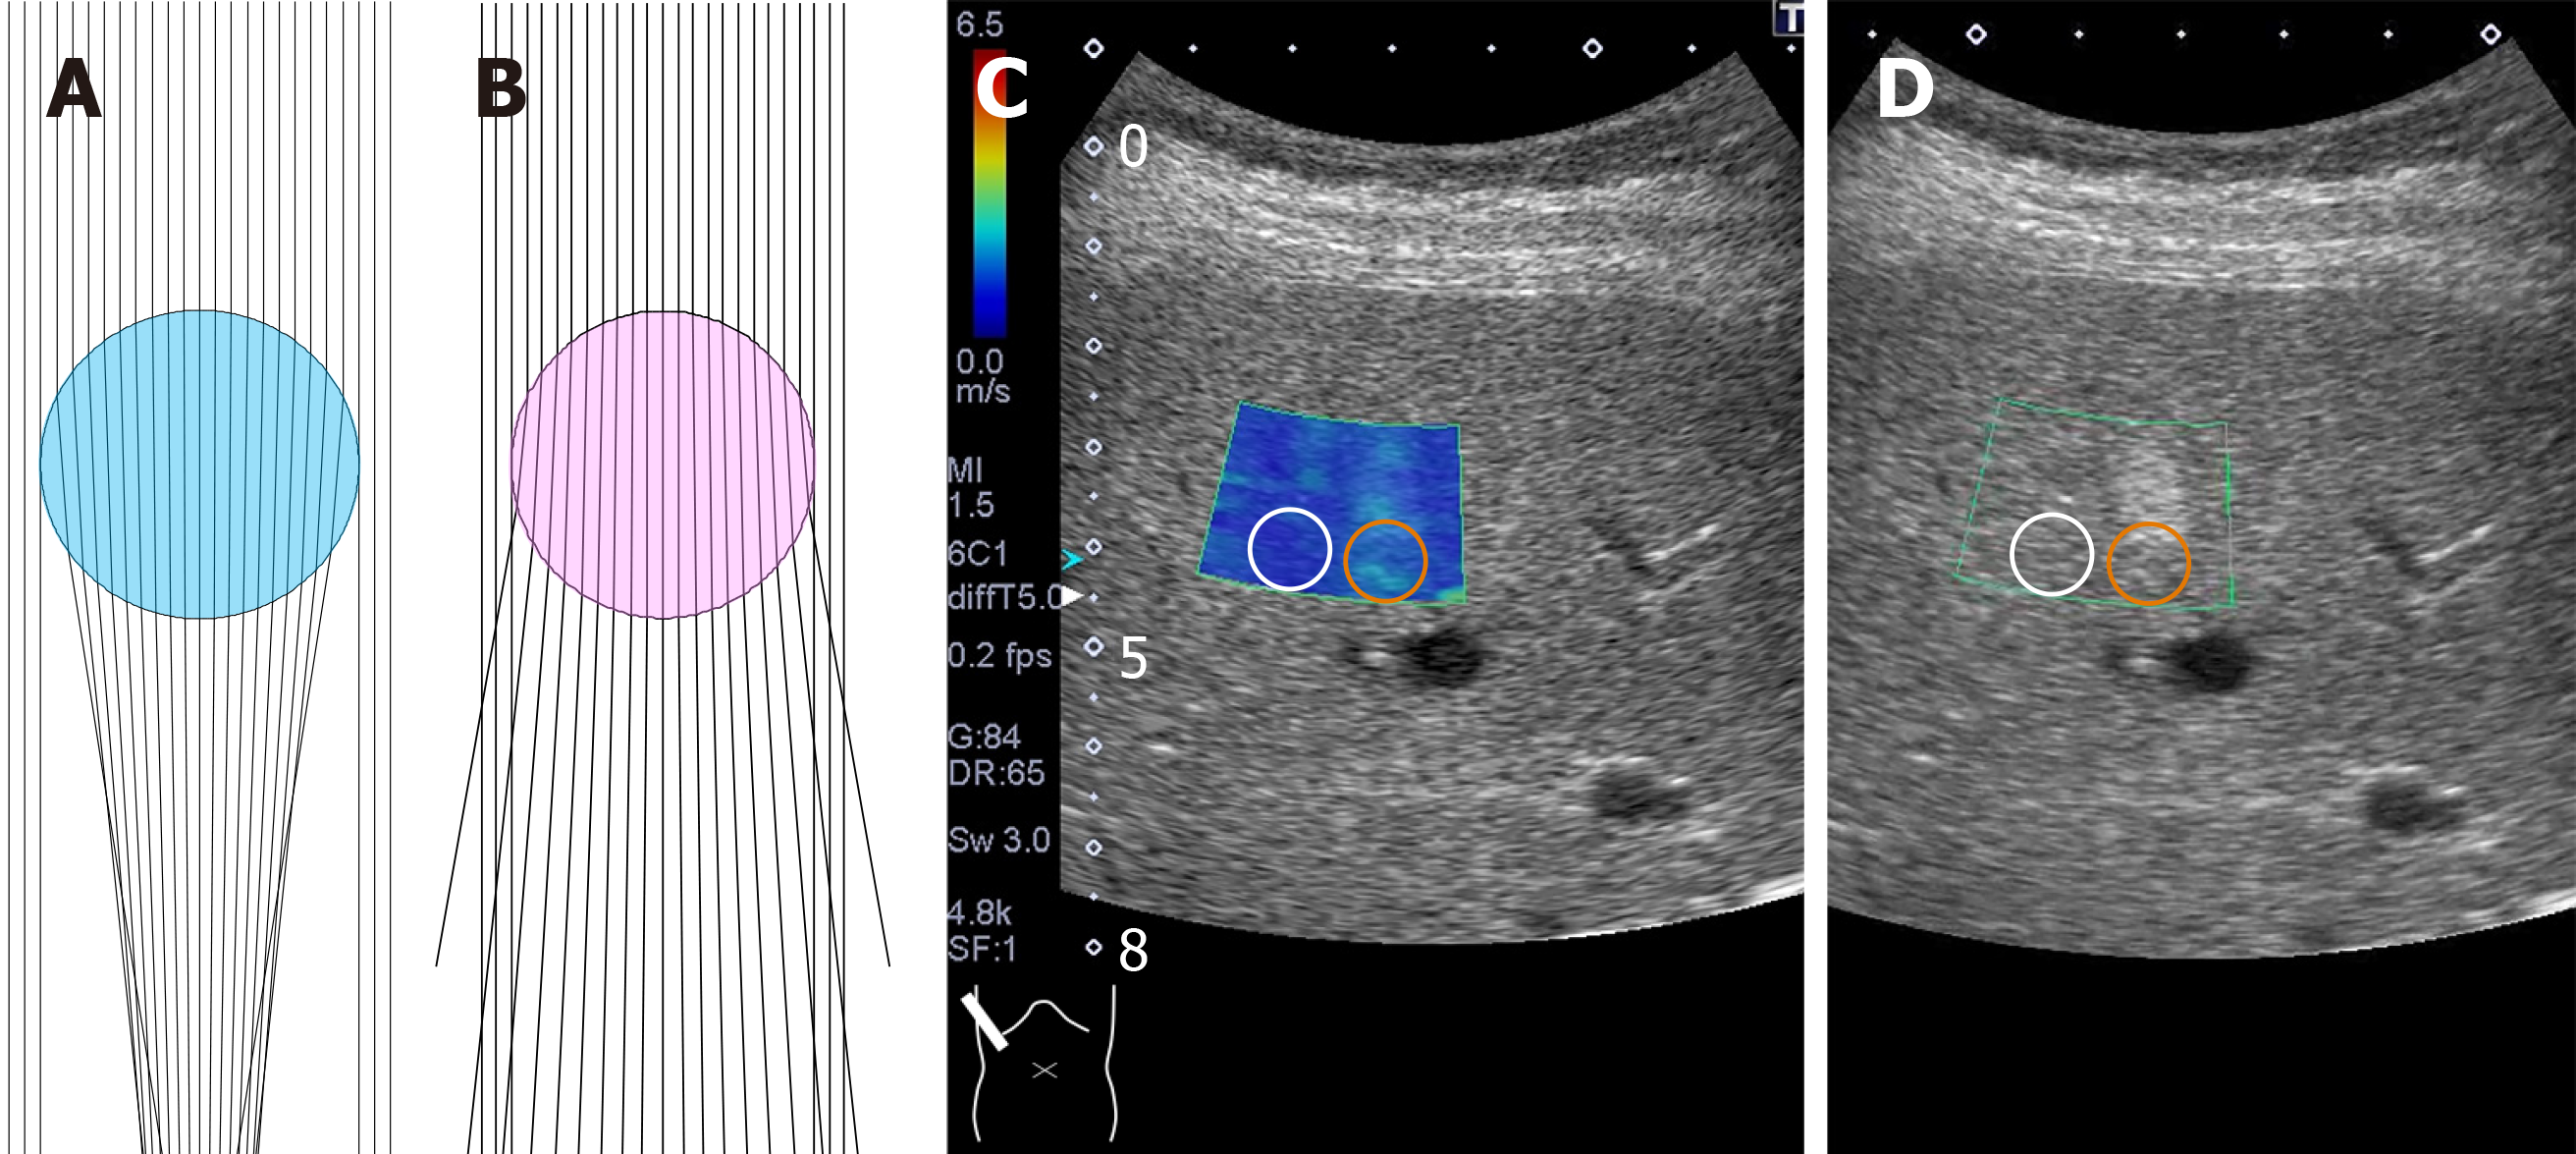
Figure 9 Computer simulation model of deviated push-pulses.
A: Surrounding tissue acoustic speed is 1540 m/s and that of tumor (blue) is 1480 m/s; B: Surrounding tissue acoustic speed is 1540 m/s and that of tumor (pink) is 1600 m/s [A and B — the push-pulses change direction twice at two interfaces (upper and lower) of the surface of the lesion]; C: Two-dimensional shear wave elastography shows the posterior zone behind the lesion (red circle) to have a greater shear wave velocity (1.67 ± 0.19 m/s) than the surrounding hepatic tissue (1.07 ± 0.08 m/s) (white circle); D: Hepatic ultrasound reveals a 2 cm × 2 cm echogenic mass (hemangioma) in segment 5.
- Citation: Naganuma H, Ishida H, Uno A, Nagai H, Kuroda H, Ogawa M. Diagnostic problems in two-dimensional shear wave elastography of the liver. World J Radiol 2020; 12(5): 76-86
- URL: https://www.wjgnet.com/1949-8470/full/v12/i5/76.htm
- DOI: https://dx.doi.org/10.4329/wjr.v12.i5.76


