Copyright
©The Author(s) 2020.
World J Radiol. May 28, 2020; 12(5): 76-86
Published online May 28, 2020. doi: 10.4329/wjr.v12.i5.76
Published online May 28, 2020. doi: 10.4329/wjr.v12.i5.76
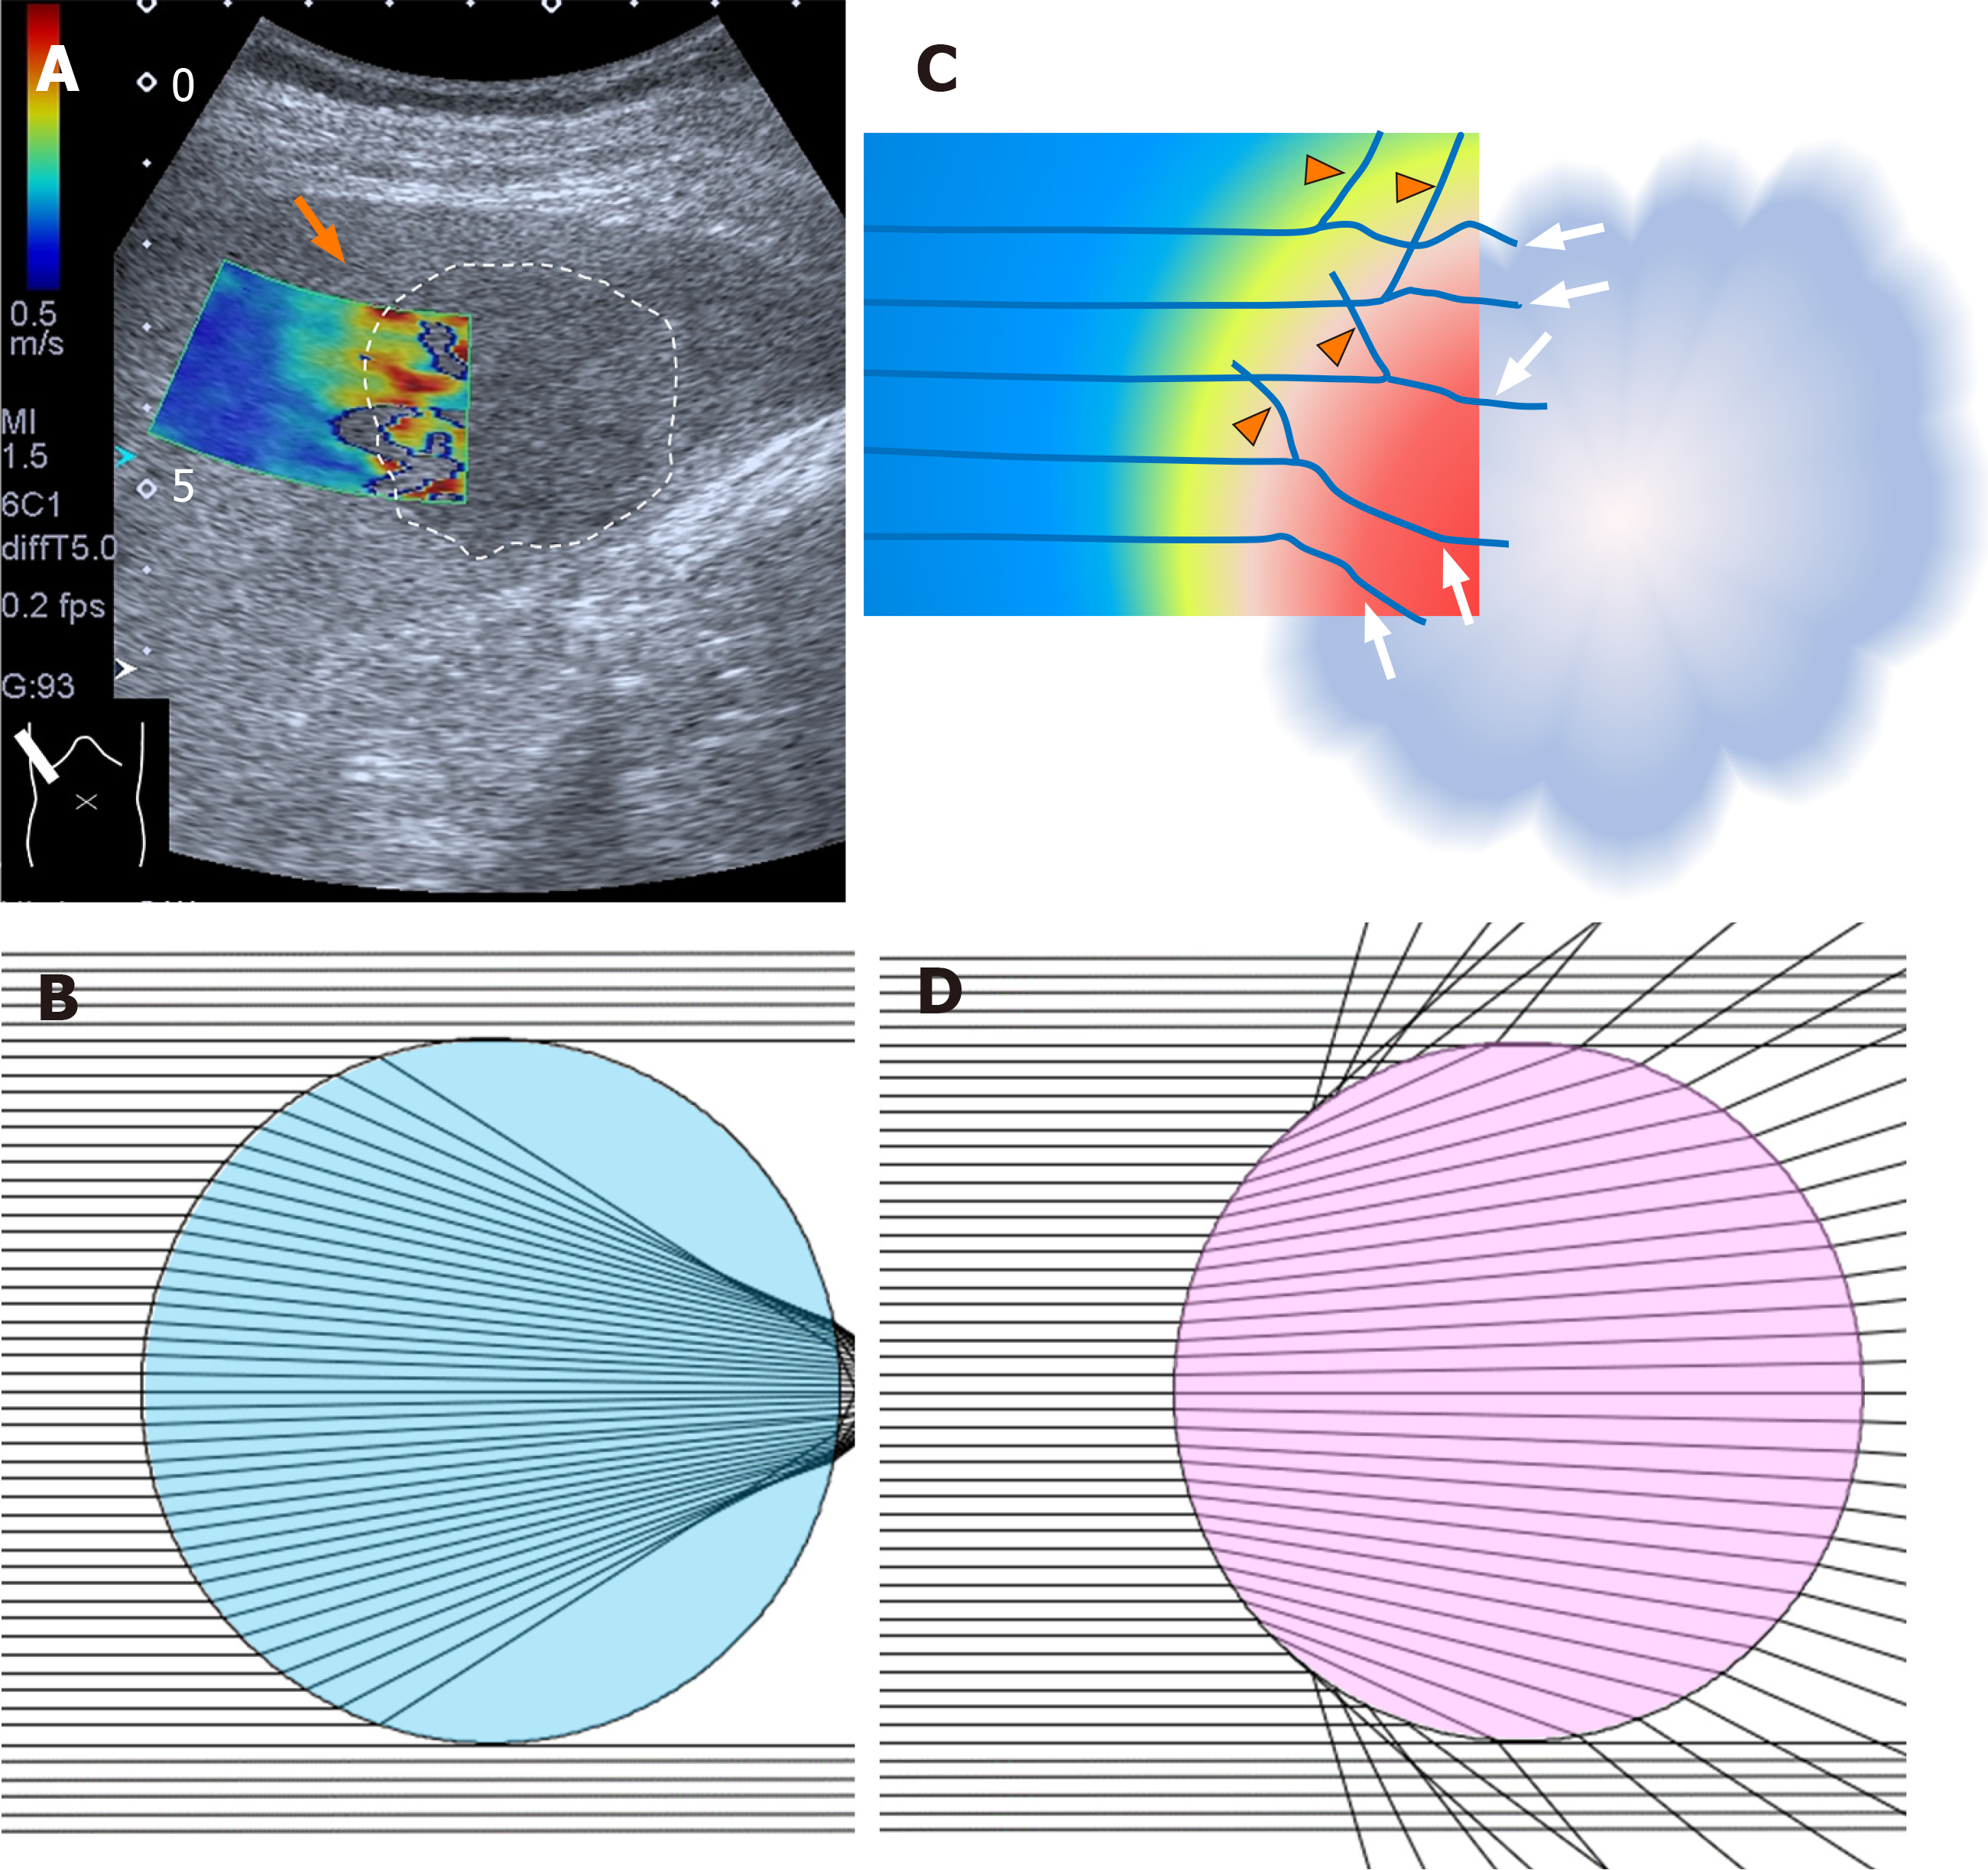
Figure 7 Two-dimensional shear wave elastography of liver tumor.
A: Two-dimensional SW elastography of a liver tumor (encircled area) shows an irregular-shaped round area consisting of multiple layers of different colors (arrows); B: When the tumor has a lesser SW value than the surrounding tissue. Computer simulation model shows that all SWs deviate largely at the surrounding tissue (in this case, SW velocity 1.5 m/s) -liver tumor (in this case, SW velocity 1.0 m/s) interface; C: When the tumor has a greater SW value than the surrounding tissue. Computer simulation model shows that all SWs deviate largely at the surrounding tissue (in this case, SW velocity 1.5 m/s) -liver tumor (in this case, SW velocity 2.0 m/s) interface; D: Schematic drawing of mode of SWs around the surrounding tissue-liver tumor interface (arrows: deviated SWs; arrow heads: reflected SWs). SW: Shear wave.
- Citation: Naganuma H, Ishida H, Uno A, Nagai H, Kuroda H, Ogawa M. Diagnostic problems in two-dimensional shear wave elastography of the liver. World J Radiol 2020; 12(5): 76-86
- URL: https://www.wjgnet.com/1949-8470/full/v12/i5/76.htm
- DOI: https://dx.doi.org/10.4329/wjr.v12.i5.76


