Copyright
©The Author(s) 2020.
World J Radiol. Oct 28, 2020; 12(10): 231-246
Published online Oct 28, 2020. doi: 10.4329/wjr.v12.i10.231
Published online Oct 28, 2020. doi: 10.4329/wjr.v12.i10.231
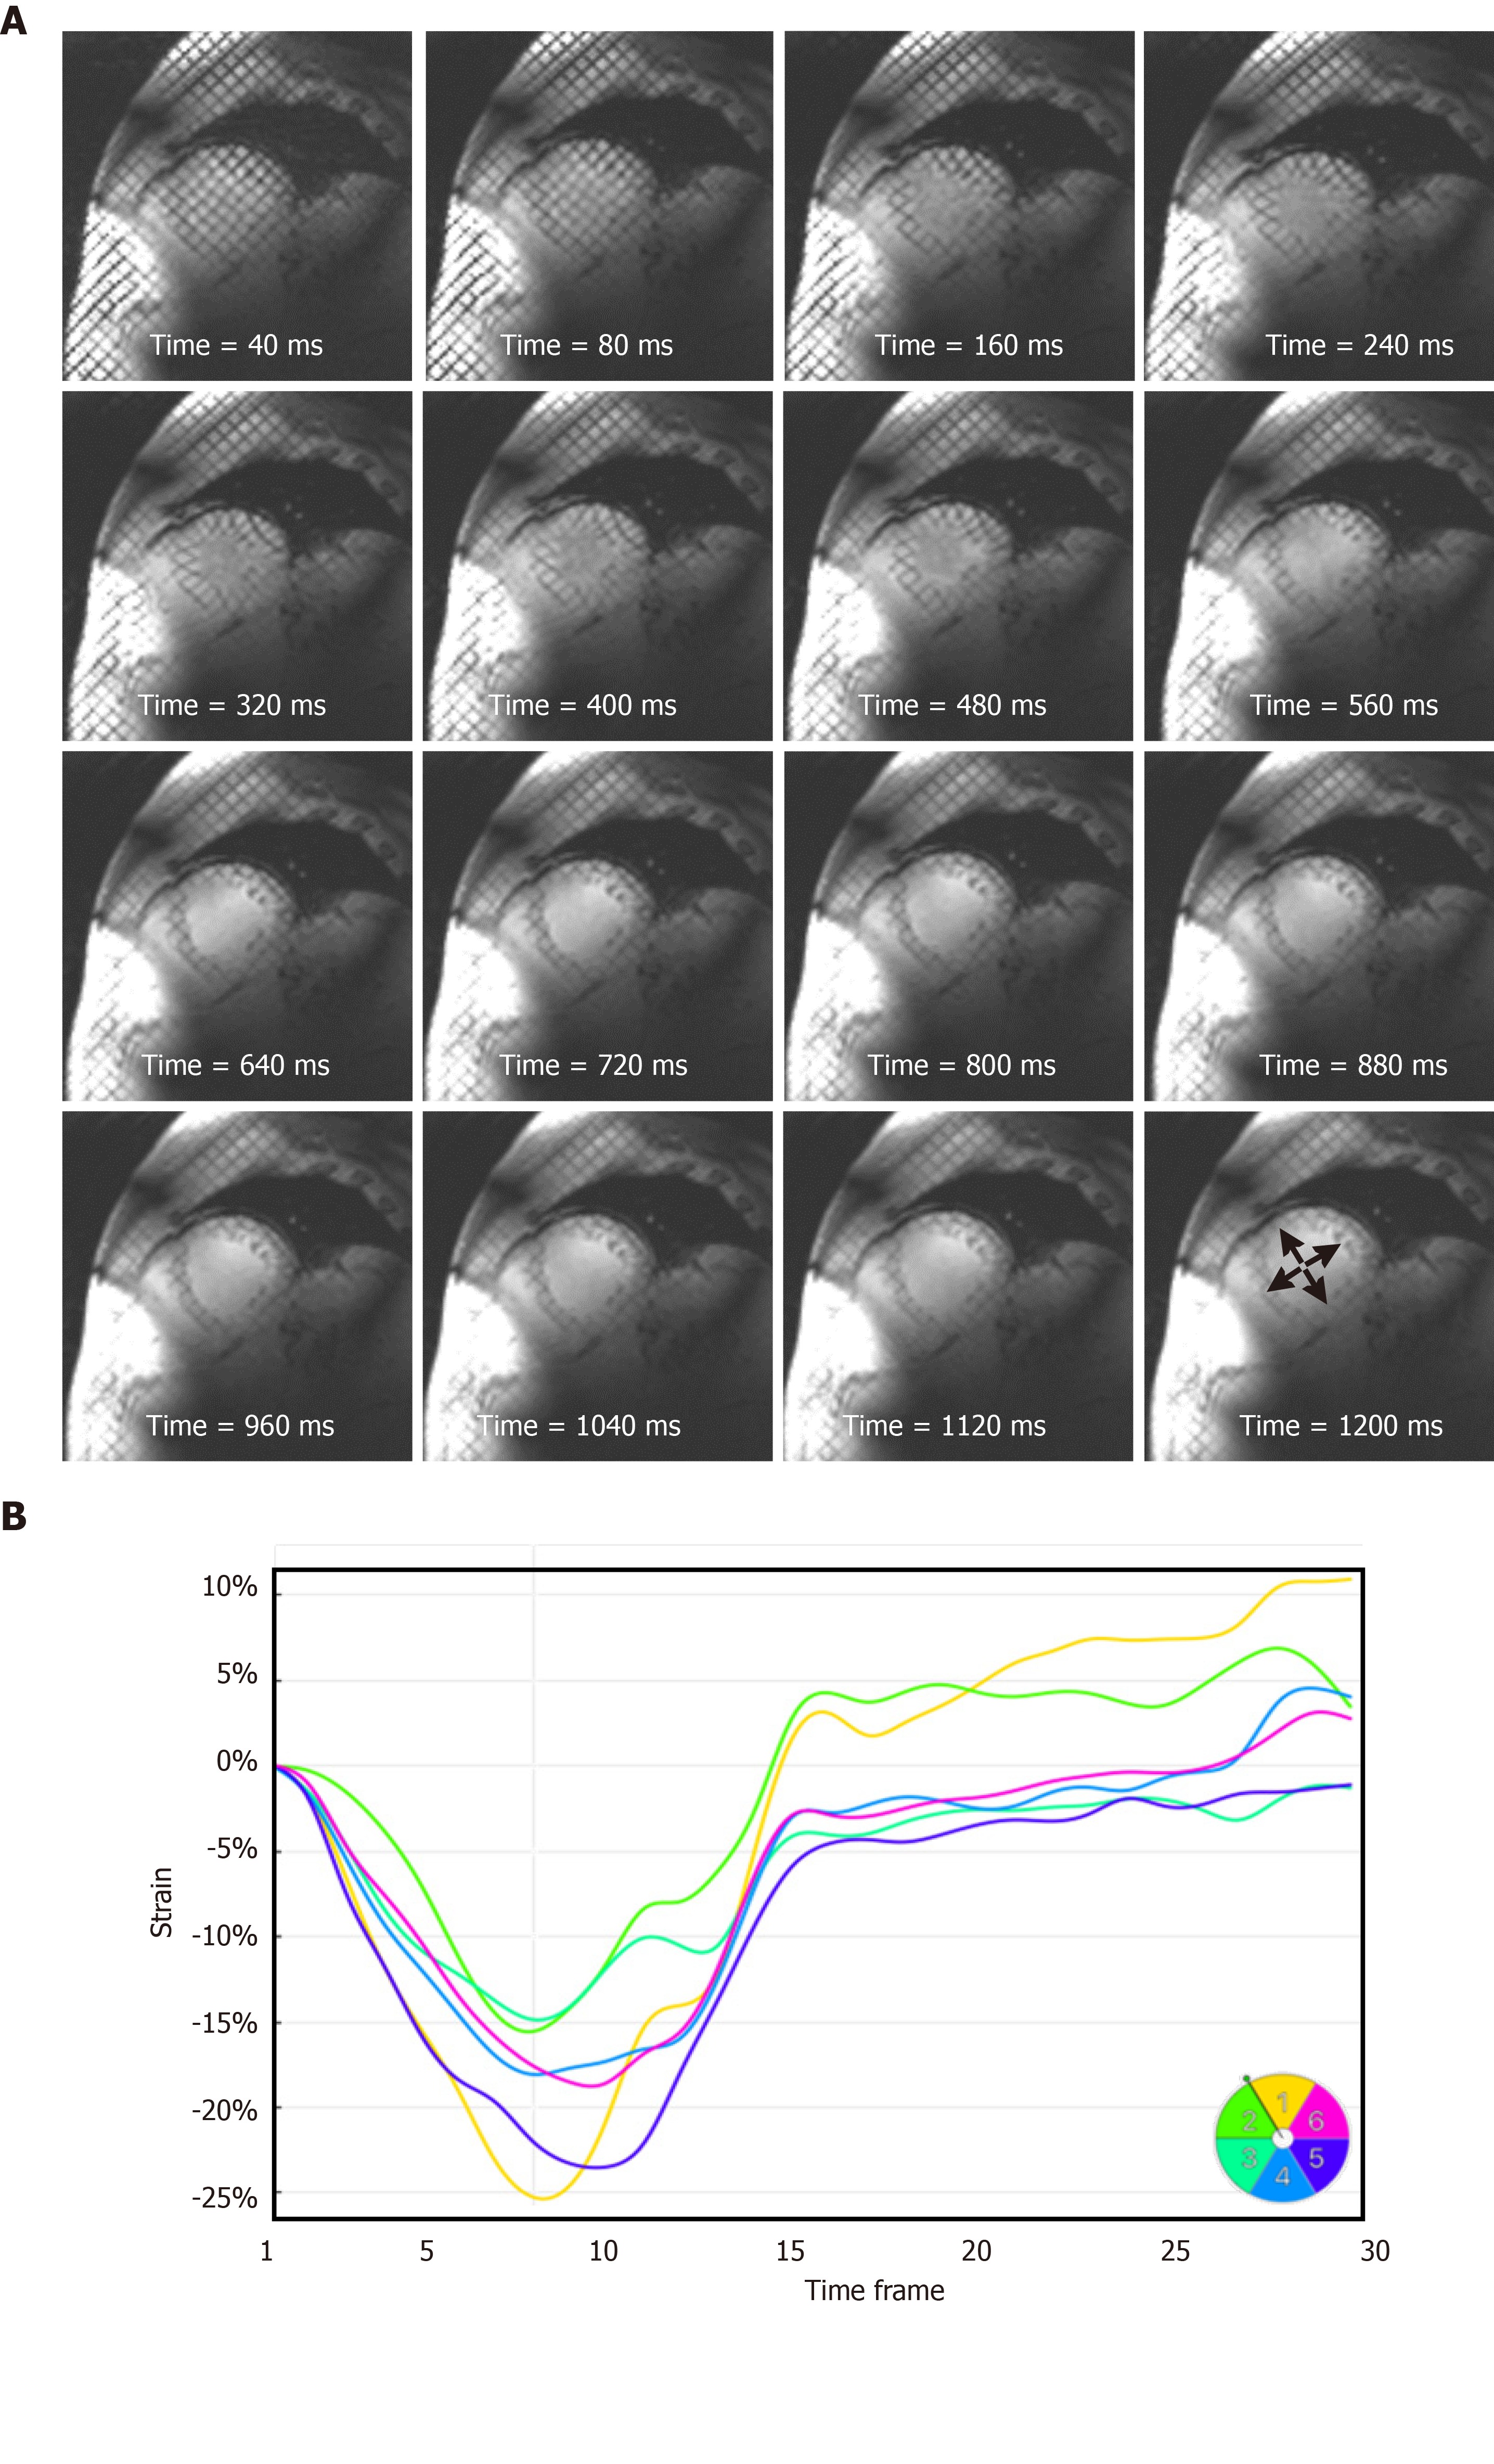
Figure 7 Strain analysis throughout the whole cardiac cycle at 7T cardiovascular magnetic resonance.
A: A series of tagged images acquired at different timepoints of a mid-ventricular short-axis slice throughout a 1200 ms cardiac cycle, showing tagging persistence until the last timeframe (arrows), which allows for measuring strain throughout end-diastole, which is not feasible at low magnetic field strength where the tagging pattern fades before the end of the cardiac cycle; B: Circumferential strain curves showing strain evolution throughout the whole cardiac cycle in different left-ventricular myocardial segments of the slice in (A). Segments are numbered according to American Heart Association 17-segment model.
- Citation: Ibrahim EH, Arpinar VE, Muftuler LT, Stojanovska J, Nencka AS, Koch KM. Cardiac functional magnetic resonance imaging at 7T: Image quality optimization and ultra-high field capabilities. World J Radiol 2020; 12(10): 231-246
- URL: https://www.wjgnet.com/1949-8470/full/v12/i10/231.htm
- DOI: https://dx.doi.org/10.4329/wjr.v12.i10.231


