Copyright
©The Author(s) 2020.
World J Radiol. Oct 28, 2020; 12(10): 231-246
Published online Oct 28, 2020. doi: 10.4329/wjr.v12.i10.231
Published online Oct 28, 2020. doi: 10.4329/wjr.v12.i10.231
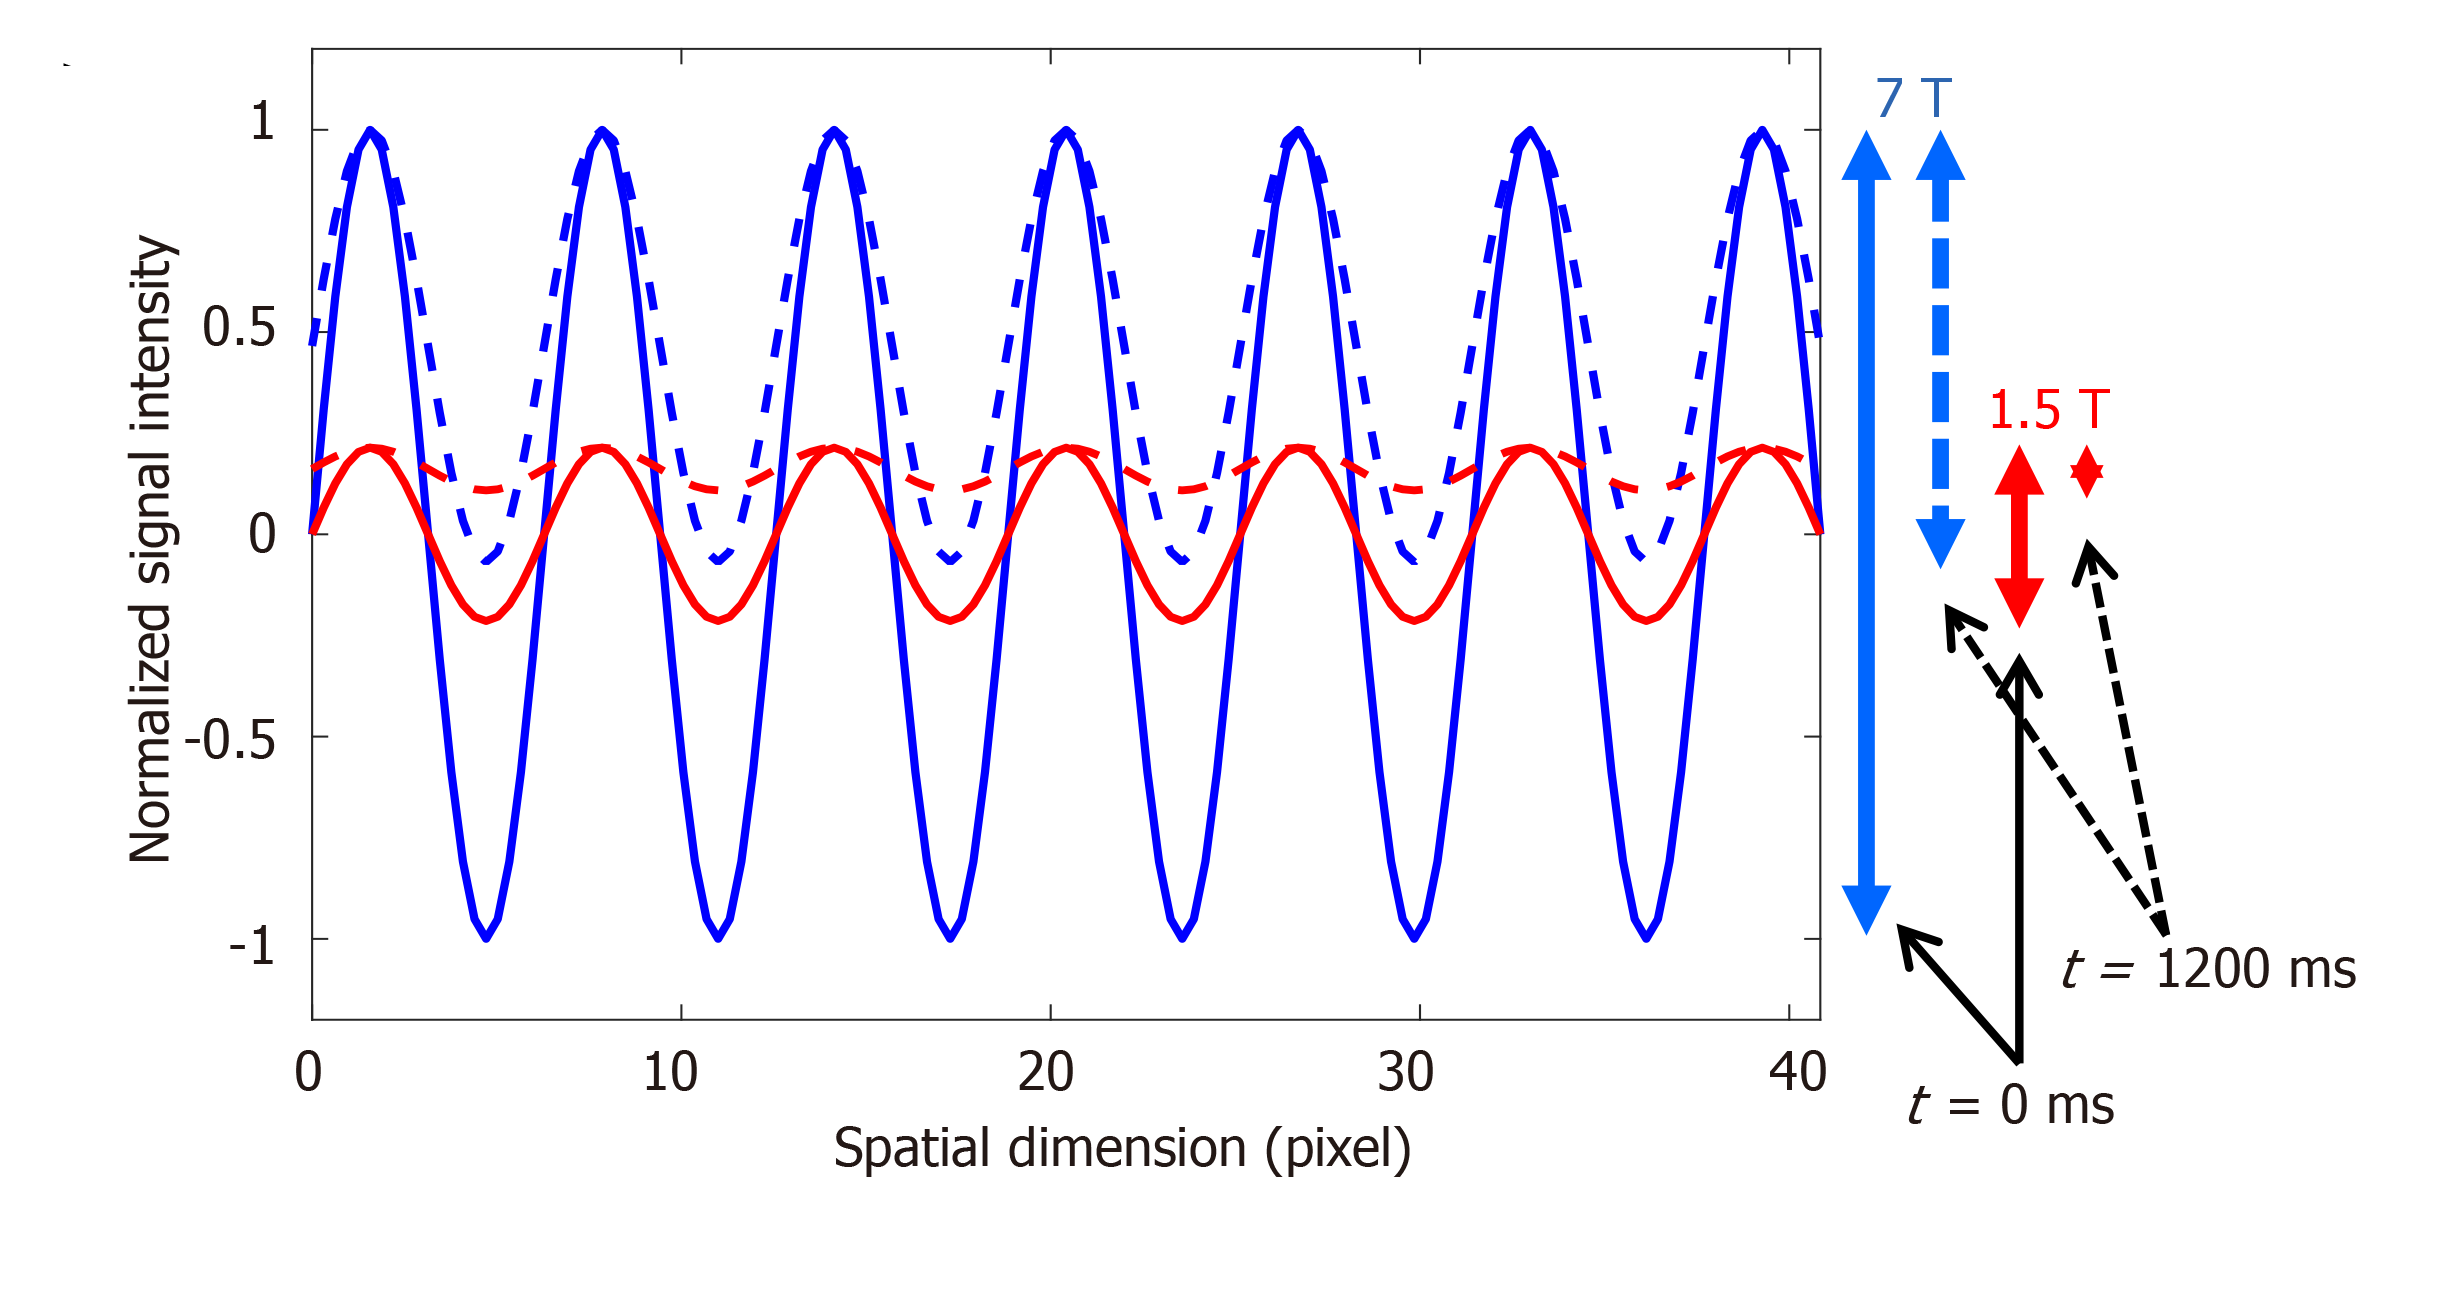
Figure 6 Improved tagging persistence at 7T cardiovascular magnetic resonance.
Numerical simulation of the effect of magnetic field strength on the tagging pattern persistence. The tagging patterns (blue, 7T; red, 1.5T) have maximum contrast (peak-to-peak difference) immediately after tagging creation at the beginning of the cardiac cycle (time = 0 ms), as represented by the solid lines. Note the difference in tagging contrast (vertical solid arrows on the right) corresponding to the difference in field strength. With time, longitudinal magnetization experiences exponential relaxation trying to reach equilibrium with different T1 values of the myocardium depending on the magnetic field strength (T1 = 850 ms and 1900 ms are used for 1.5T and 7T, respectively). By the end of a 1200 ms cardiac cycle (assuming heart rate of 50 bpm), the tagging patterns have experienced fading (dotted lines), such that there is a significant difference in tagging contrast between 7T and 1.5T, as represented by the vertical dotted arrows on the right, which results in diminished visibility of the tagging pattern by the end of the cardiac cycle at the low field strength.
- Citation: Ibrahim EH, Arpinar VE, Muftuler LT, Stojanovska J, Nencka AS, Koch KM. Cardiac functional magnetic resonance imaging at 7T: Image quality optimization and ultra-high field capabilities. World J Radiol 2020; 12(10): 231-246
- URL: https://www.wjgnet.com/1949-8470/full/v12/i10/231.htm
- DOI: https://dx.doi.org/10.4329/wjr.v12.i10.231


