Copyright
©The Author(s) 2020.
World J Radiol. Oct 28, 2020; 12(10): 231-246
Published online Oct 28, 2020. doi: 10.4329/wjr.v12.i10.231
Published online Oct 28, 2020. doi: 10.4329/wjr.v12.i10.231
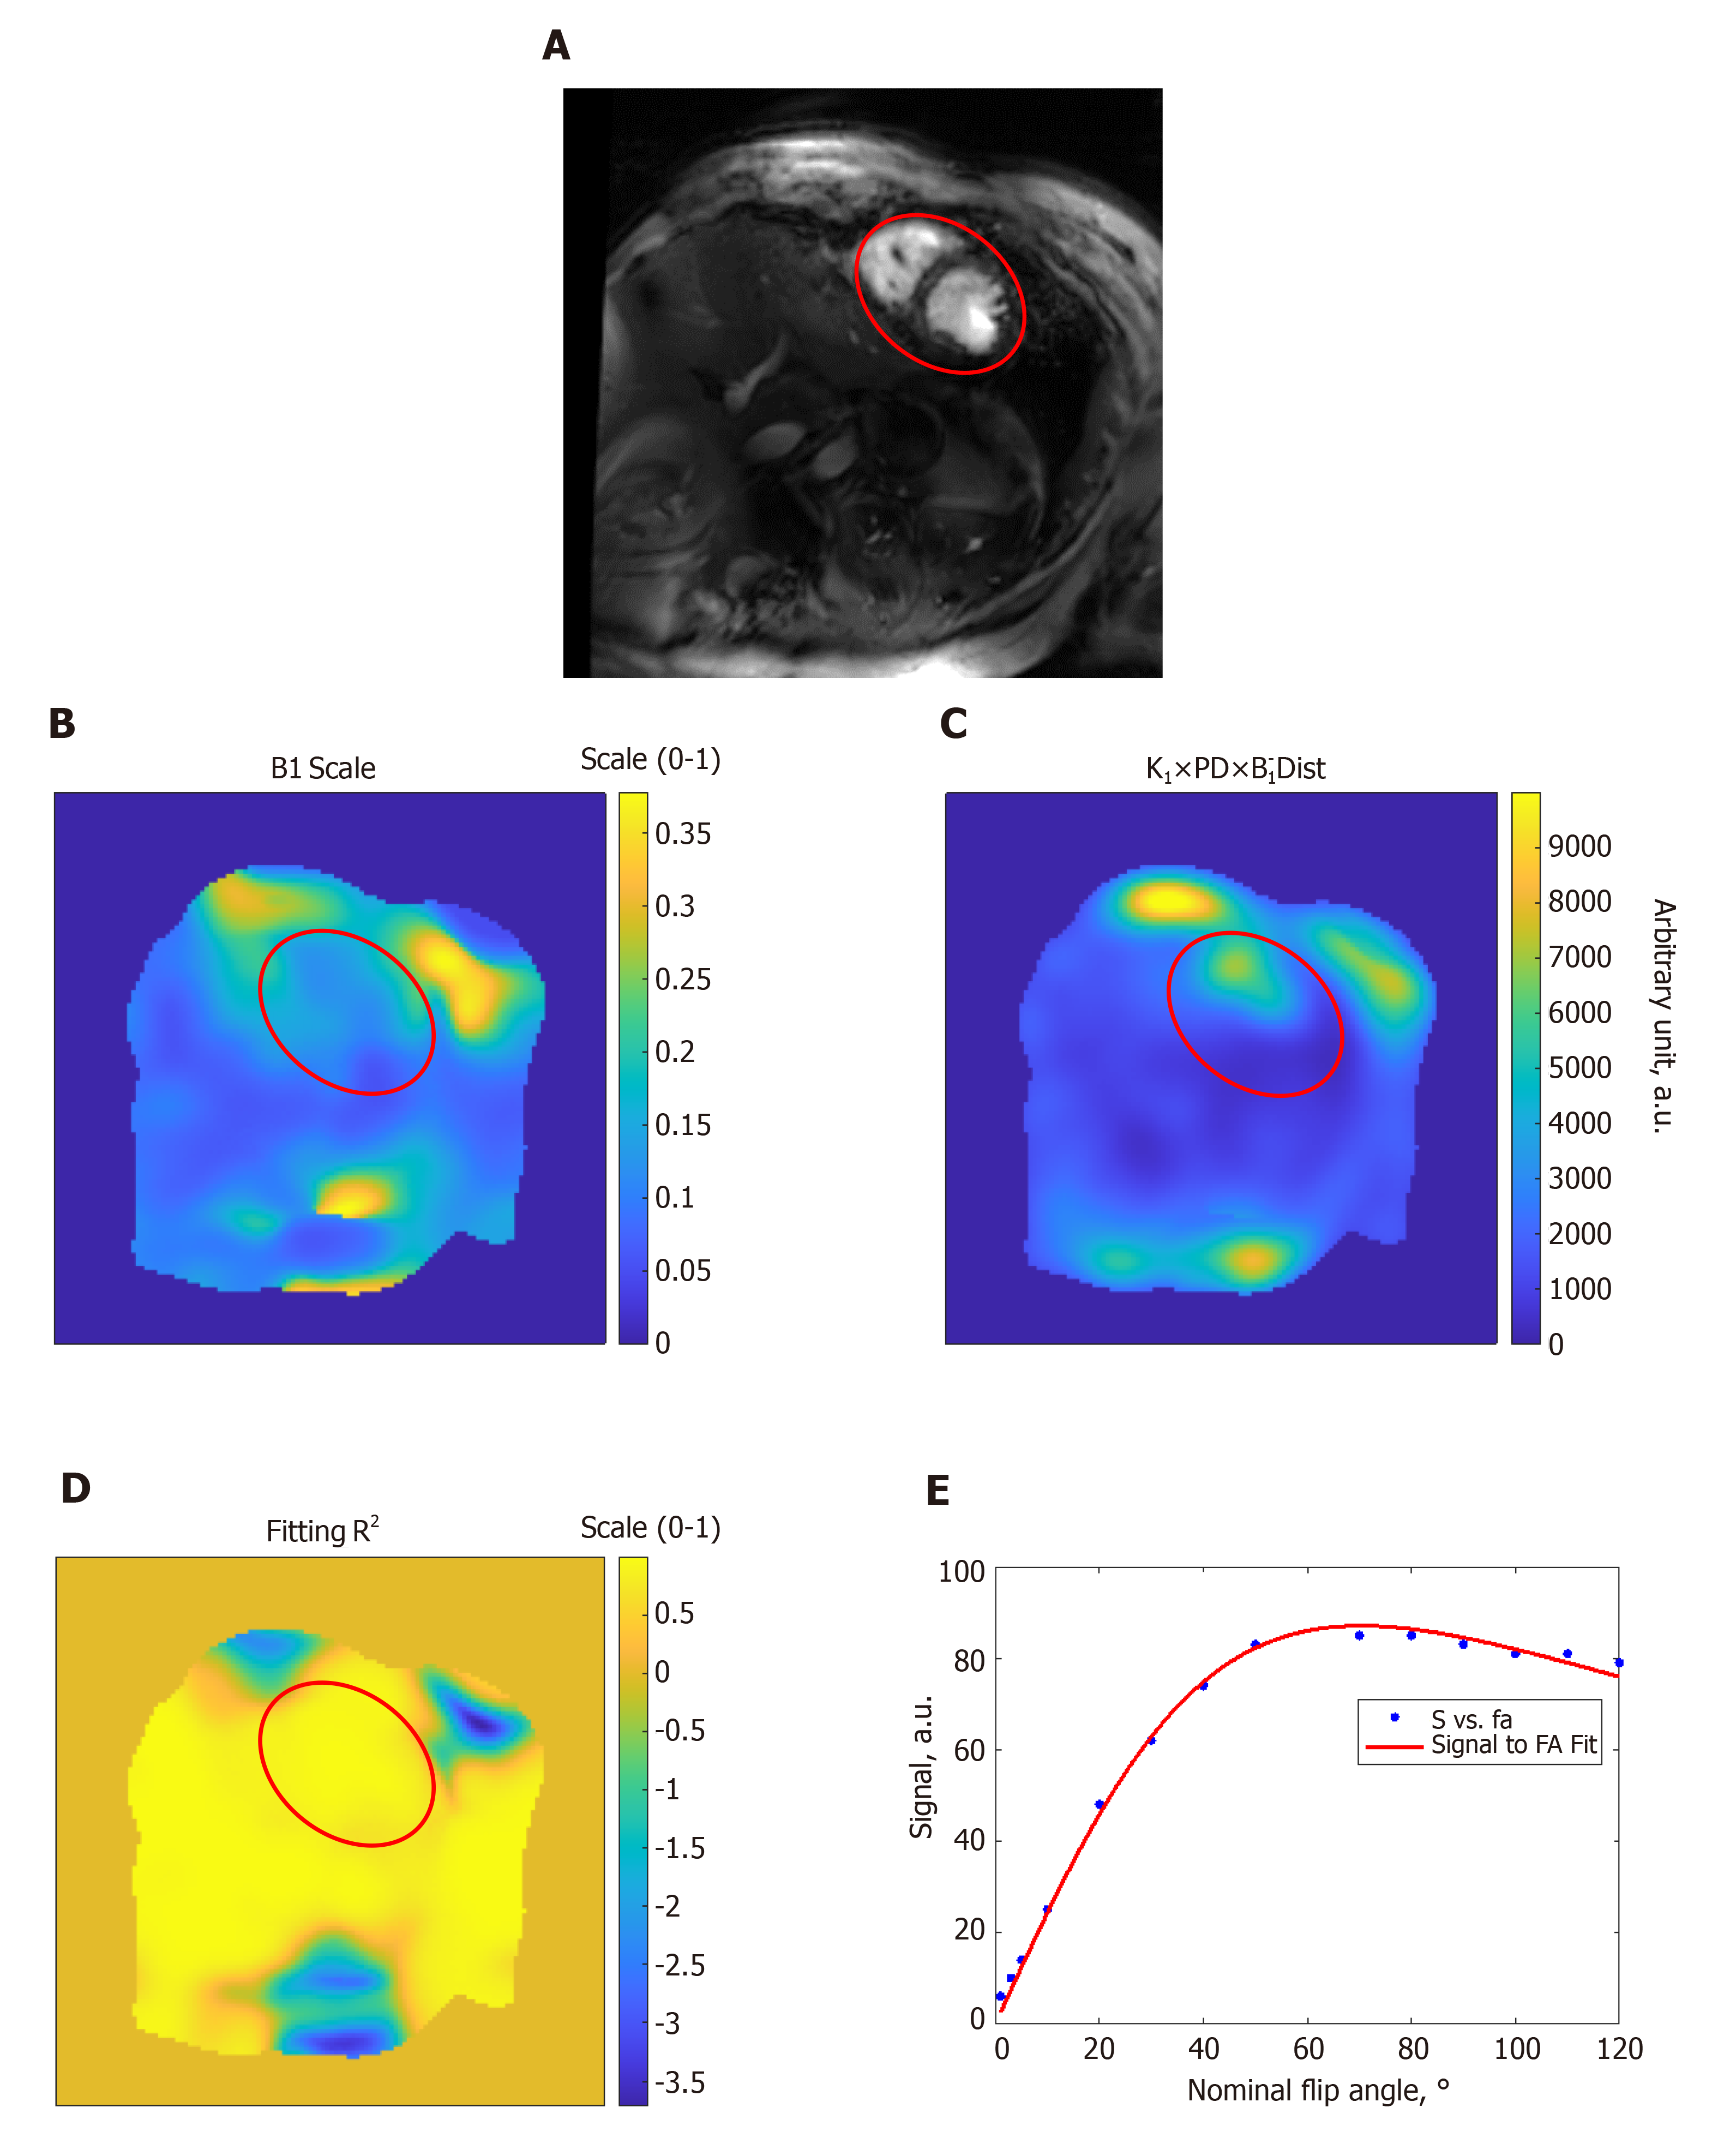
Figure 2 Estimation of the B1 transmission field in a volunteer scan.
A: Gradient-echo short-axis image; B: B1 scale factor map (range, 0 to 1); C: Proton density distribution map (arbitrary units; a.u.); D: R2 fitting map (range, 0 to 1) shows excellent simulation fittings; E: Example of signal intensity measurements (arbitrary units; a.u.) at different flip angles in degrees (dots) and the fitting curve inside the heart region (red circle). The results show altered B1 field across the imaged slice. FA: Flip angle.
- Citation: Ibrahim EH, Arpinar VE, Muftuler LT, Stojanovska J, Nencka AS, Koch KM. Cardiac functional magnetic resonance imaging at 7T: Image quality optimization and ultra-high field capabilities. World J Radiol 2020; 12(10): 231-246
- URL: https://www.wjgnet.com/1949-8470/full/v12/i10/231.htm
- DOI: https://dx.doi.org/10.4329/wjr.v12.i10.231


