Copyright
©The Author(s) 2019.
World J Radiol. Nov 28, 2019; 11(11): 134-143
Published online Nov 28, 2019. doi: 10.4329/wjr.v11.i11.134
Published online Nov 28, 2019. doi: 10.4329/wjr.v11.i11.134
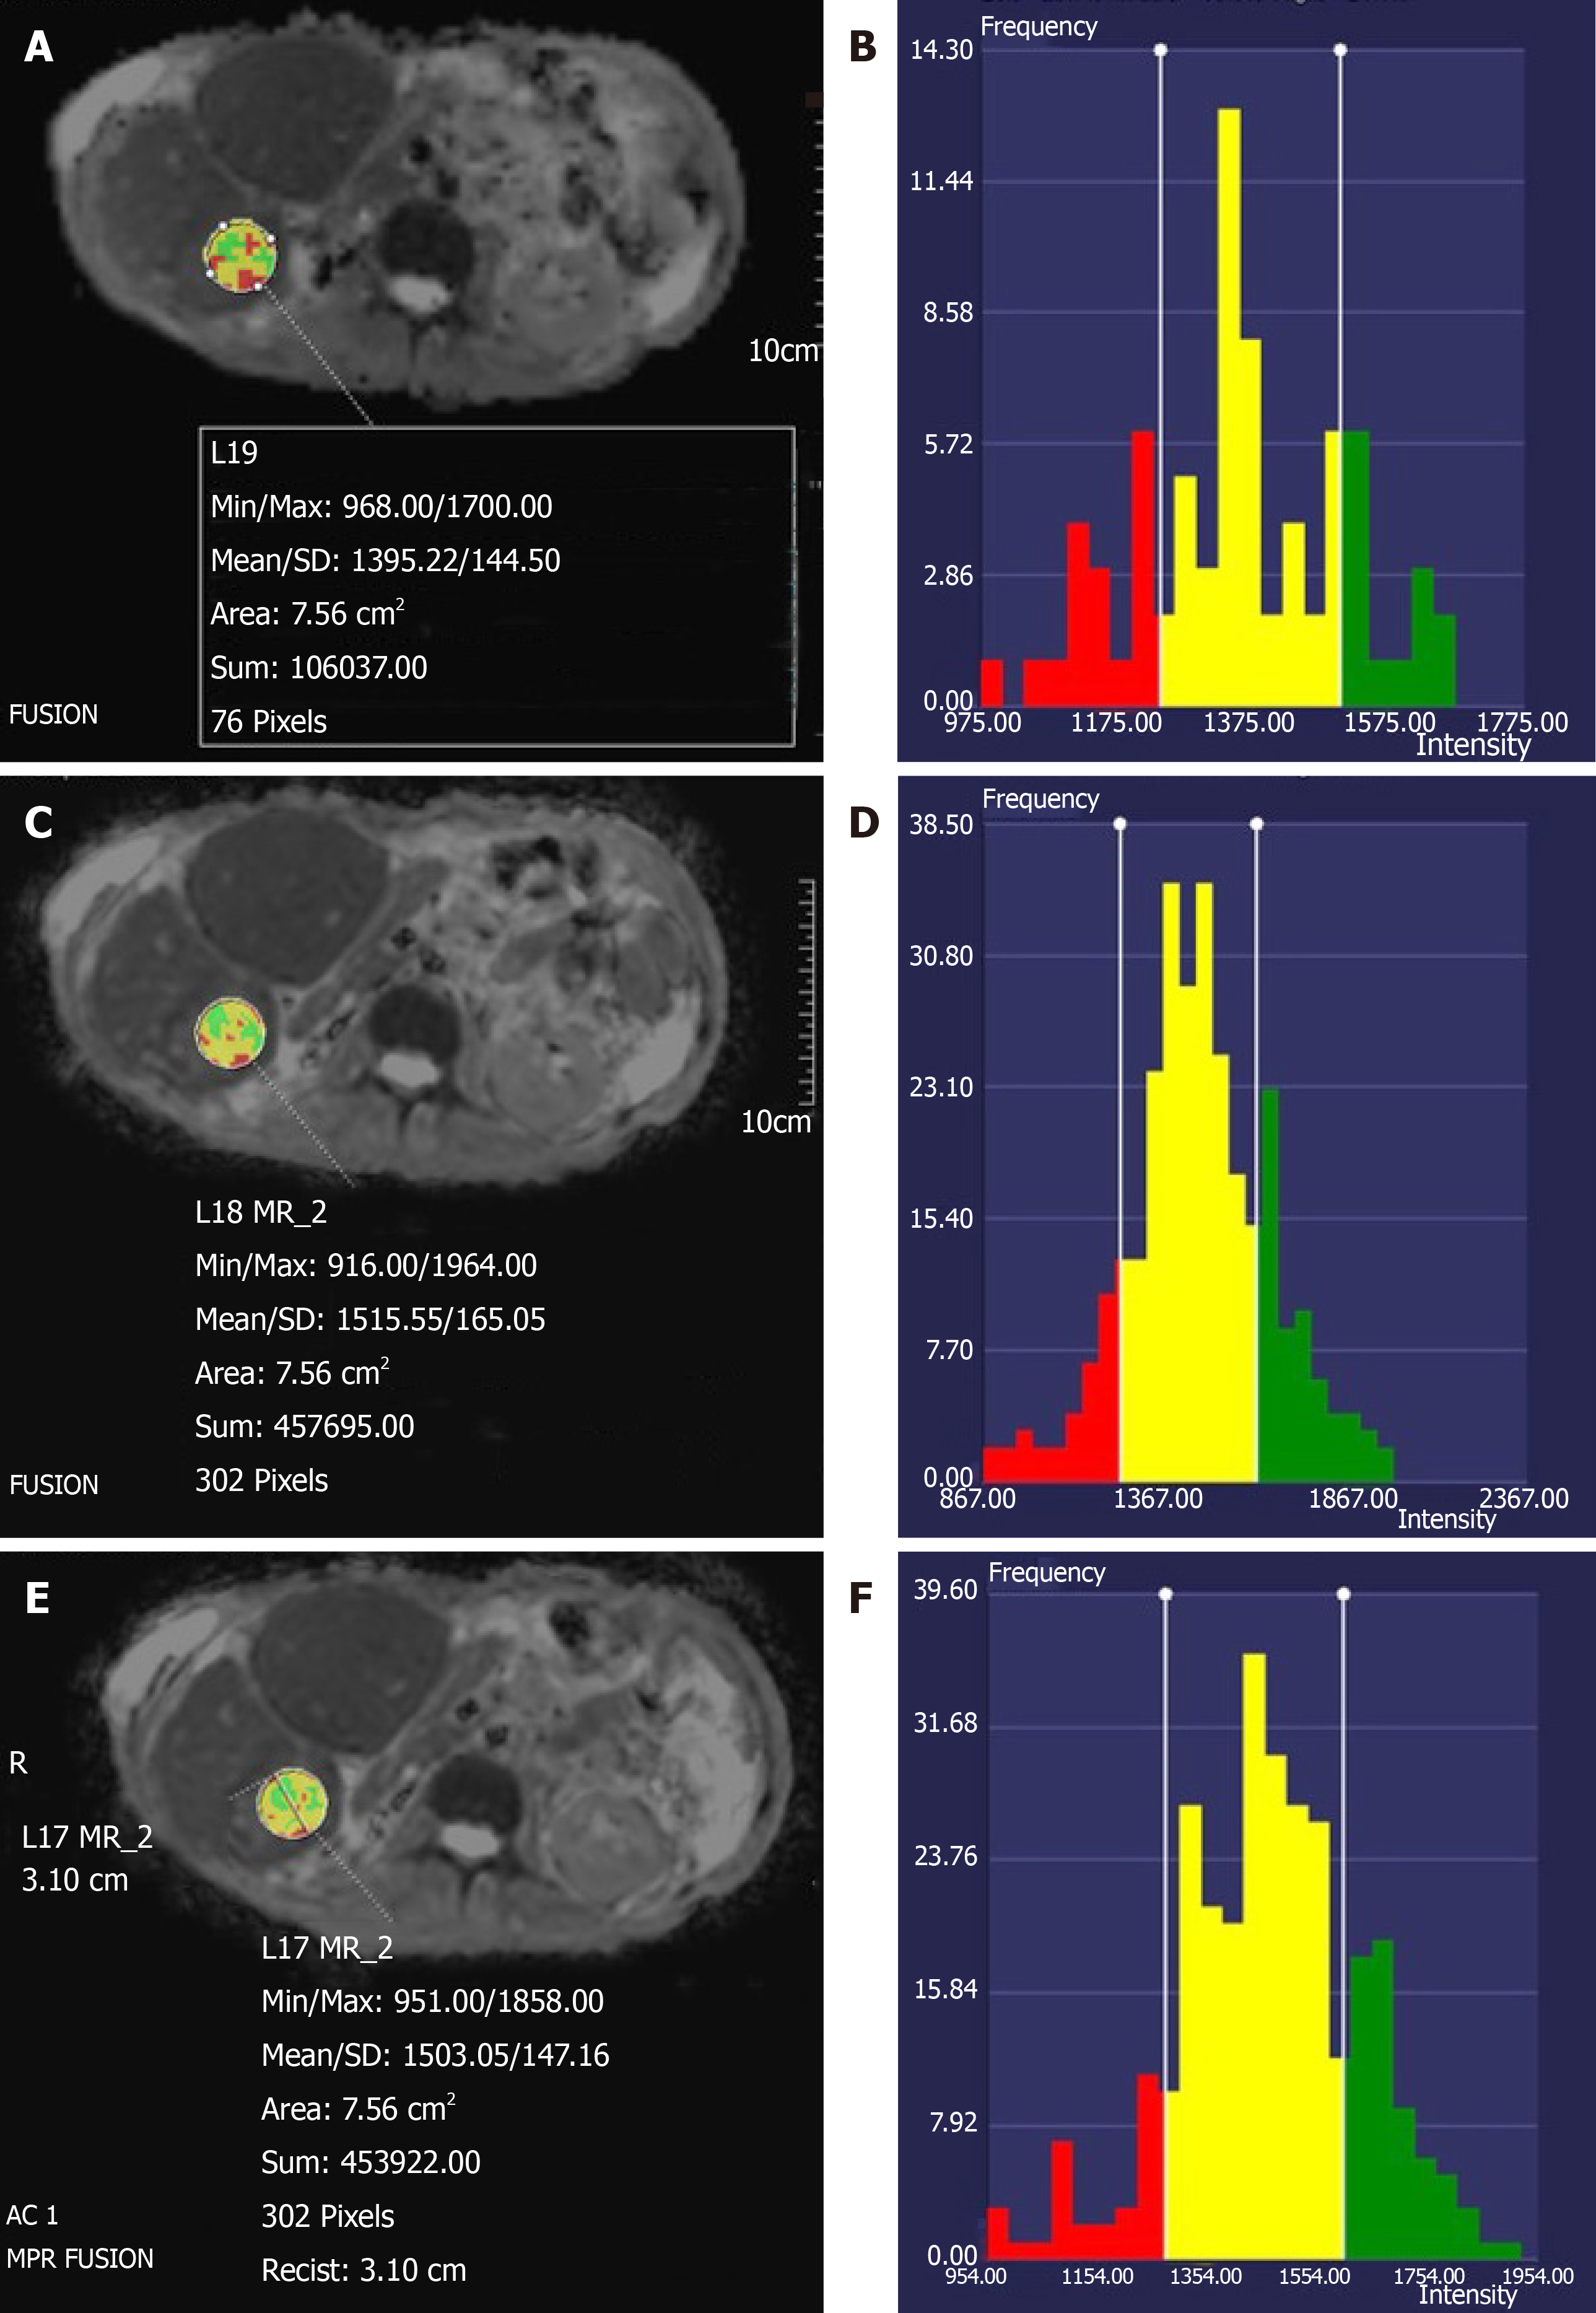
Figure 2 Axial apparent diffusion coefficients maps of the abdomen of a 61-year-old woman with colorectal cancer liver metastases, with corresponding apparent diffusion coefficients histograms.
The top image corresponds to the apparent diffusion coefficients (ADC) map showing the region of interest (ROI), with color-coded ADC values. The diagram on the right is the corresponding ADC histogram. A: Axial ADC map obtained with free-breathing diffusion-weighted imaging (DWI); B: ADC histogram corresponding to the ROI in (A); C: Axial ADC map obtained with simultaneous multi-slice DWI; D: ADC histogram corresponding to the ROI in (C); E: Axial ADC map obtained with prospective acquisition correction (PACE)-DWI; F: ADC histogram corresponding to the ROI in (E). In this case, PACE-DWI and simultaneous multislice were selected as the qualitatively superior technique because of the higher number of pixels that were available for analysis, as shown by the frequency scale.
- Citation: Szklaruk J, Son JB, Wei W, Bhosale P, Javadi S, Ma J. Comparison of free breathing and respiratory triggered diffusion-weighted imaging sequences for liver imaging. World J Radiol 2019; 11(11): 134-143
- URL: https://www.wjgnet.com/1949-8470/full/v11/i11/134.htm
- DOI: https://dx.doi.org/10.4329/wjr.v11.i11.134


