Copyright
©The Author(s) 2018.
World J Radiol. Sep 28, 2018; 10(9): 91-99
Published online Sep 28, 2018. doi: 10.4329/wjr.v10.i9.91
Published online Sep 28, 2018. doi: 10.4329/wjr.v10.i9.91
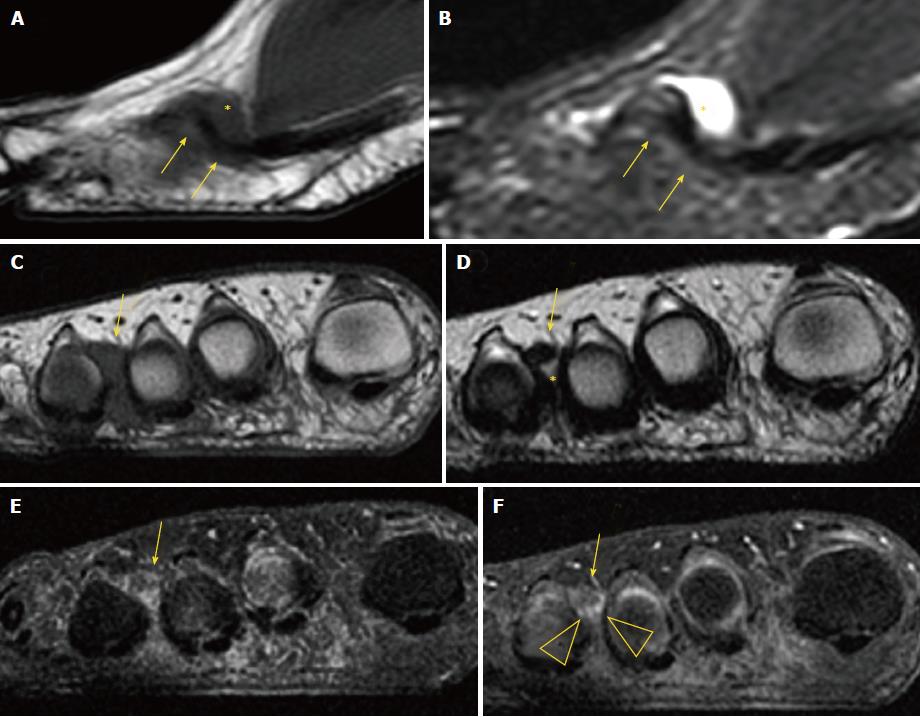
Figure 6 Magnetic resonance imaging of Morton’s neuroma.
A, B: Sagittal T1 (A) and short tau inversion recovery (B) of Morton’s neuroma and bursa; C, D: Coronal T1 (C) and T2 (D) of Morton’s neuroma and bursa. Coronal T1 fat before (A) and after gadolinium administration (B), showing enhancement of the bursal tissue surrounding the neuroma (arrowhead). In all images, arrows indicate Morton’s neuroma and asterisks (*) indicate bursa.
- Citation: Santiago FR, Muñoz PT, Pryest P, Martínez AM, Olleta NP. Role of imaging methods in diagnosis and treatment of Morton’s neuroma. World J Radiol 2018; 10(9): 91-99
- URL: https://www.wjgnet.com/1949-8470/full/v10/i9/91.htm
- DOI: https://dx.doi.org/10.4329/wjr.v10.i9.91


