Copyright
©The Author(s) 2018.
World J Radiol. Apr 28, 2018; 10(4): 30-45
Published online Apr 28, 2018. doi: 10.4329/wjr.v10.i4.30
Published online Apr 28, 2018. doi: 10.4329/wjr.v10.i4.30
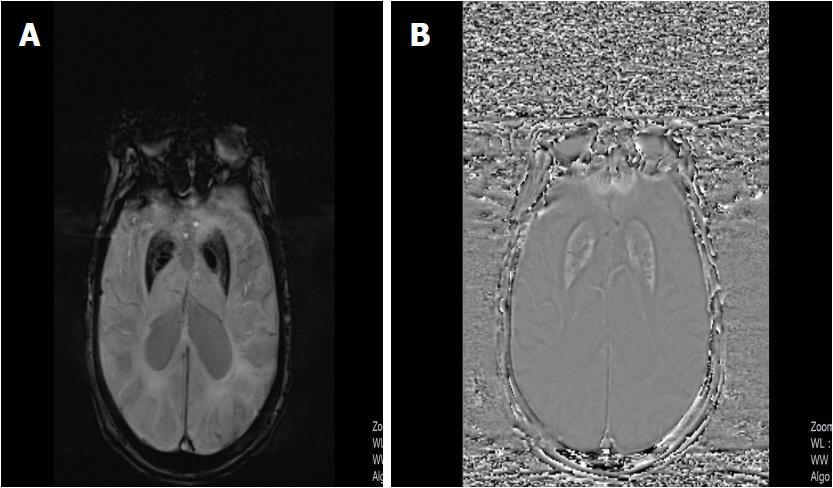
Figure 15 A 79-year-old woman with Alzhemier’s disease.
A: SWI minIP image shows hypointense signal intensity in the globus pallidus and putamen indicating increased iron deposition; B: SWI phase image reveals hyperintense signal in the basal ganglia due to the positive shift effect of paramagnetic iron. SWI: Susceptibility weighted imaging; minIP: Minimum intensity projection algorithm.
- Citation: Halefoglu AM, Yousem DM. Susceptibility weighted imaging: Clinical applications and future directions. World J Radiol 2018; 10(4): 30-45
- URL: https://www.wjgnet.com/1949-8470/full/v10/i4/30.htm
- DOI: https://dx.doi.org/10.4329/wjr.v10.i4.30


