Copyright
©The Author(s) 2018.
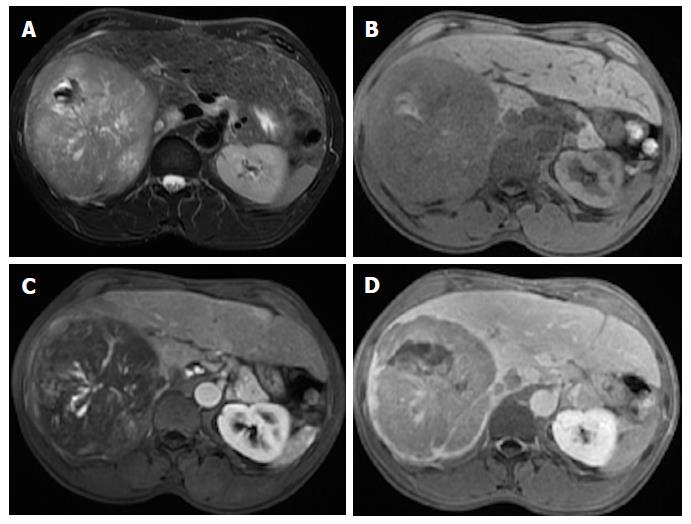
Figure 14 Blood products in a large hepatocellular carcinoma.
Fat-suppressed T2-weighted image (A), pre- (B) and post-contrast fat-suppressed 3D-GRE T1-weighted images during the late hepatic arterial (C) and delayed (D) phases. Intralesional areas of high T1 signal intensity images (B) and predominantly low T2 signal intensity (A) can be seen. Thick intralesional arteries are appreciated during the arterial phase (C) and delayed washout and capsular enhancement is also demonstrated (D) in keeping with partly hemorrhagic HCC.
- Citation: Campos-Correia D, Cruz J, Matos AP, Figueiredo F, Ramalho M. Magnetic resonance imaging ancillary features used in Liver Imaging Reporting and Data System: An illustrative review. World J Radiol 2018; 10(2): 9-23
- URL: https://www.wjgnet.com/1949-8470/full/v10/i2/9.htm
- DOI: https://dx.doi.org/10.4329/wjr.v10.i2.9


