Copyright
©The Author(s) 2018.
World J Radiol. Oct 28, 2018; 10(10): 124-134
Published online Oct 28, 2018. doi: 10.4329/wjr.v10.i10.124
Published online Oct 28, 2018. doi: 10.4329/wjr.v10.i10.124
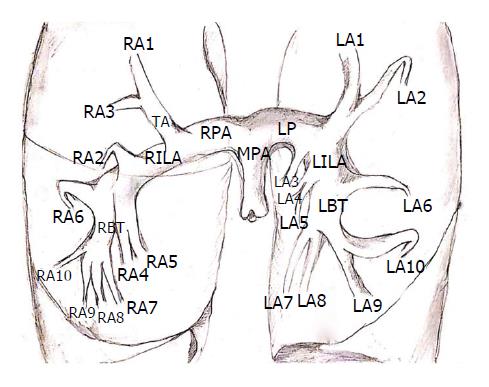
Figure 1 Schematic of segmental distribution of pulmonary arteries.
MPA: Main pulmonary artery; RPA: Right pulmonary artery; TA: Truncus anterior; RILA: Right interlobar artery; RBT: Right basal trunk; RA1: Right upper lobe, apical; RA2: Right upper lobe, posterior; RA3: Right upper lobe, anterior; RA4: Right middle lobe, lateral; RA5: Right middle lobe, medial; RA6: Right lower lobe, superior; RA7: Right lower lobe, medial basal; RA8: Right lower lobe, anterior basal; RA9: Right lower lobe, lateral basal; RA10: Right lower lobe, posterior basal; LPA: Left pulmonary artery; LILA: Left interlobar artery; LBT: Left basal trunk; LA1: Left upper lobe, apical; LA2: Left upper lobe, posterior; LA3: Left upper lobe, anterior; LA4: Lingula, superior; LA5: Lingula, inferior; LA6: Left lower lobe, superior; LA7: Left lower lobe, medial basal; LA8: Left lower lobe, anterior basal; LA9: Left lower lobe, lateral basal; LA10: Left lower lobe, posterior basal.
- Citation: Kaufman AE, Pruzan AN, Hsu C, Ramachandran S, Jacobi A, Patel I, Schwocho L, Mercuri MF, Fayad ZA, Mani V. Reproducibility of thrombus volume quantification in multicenter computed tomography pulmonary angiography studies. World J Radiol 2018; 10(10): 124-134
- URL: https://www.wjgnet.com/1949-8470/full/v10/i10/124.htm
- DOI: https://dx.doi.org/10.4329/wjr.v10.i10.124


