Copyright
©2009 Baishideng Publishing Group Co.
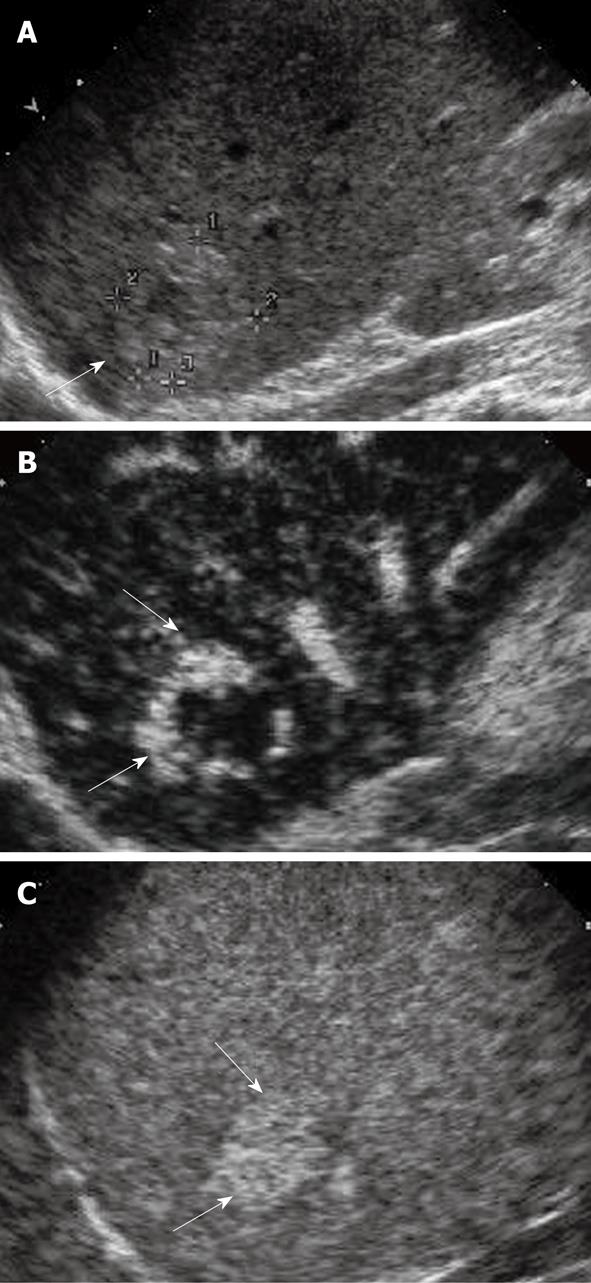
Figure 6 Hemangioma.
A: Gray-scale sonogram shows a hyper-echoic nodule (arrow); B: CEUS scan obtained in arterial phase shows peripheral nodular hyper-enhancement (arrows); C: CEUS scan at late phase shows progressive centripetal enhancement and sustained and complete hyperenhancement (arrows).
- Citation: Wong GLH, Xu HX, Xie XY. Detection Of Focal Liver Lesions In Cirrhotic Liver Using Contrast-Enhanced Ultrasound. World J Radiol 2009; 1(1): 25-36
- URL: https://www.wjgnet.com/1949-8470/full/v1/i1/25.htm
- DOI: https://dx.doi.org/10.4329/wjr.v1.i1.25


