Copyright
©The Author(s) 2017.
World J Cardiol. Sep 26, 2017; 9(9): 749-756
Published online Sep 26, 2017. doi: 10.4330/wjc.v9.i9.749
Published online Sep 26, 2017. doi: 10.4330/wjc.v9.i9.749
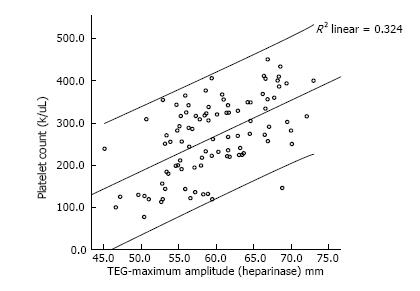
Figure 2 Correlation between platelet count and maximum amplitude after treatment with heparinase.
The estimated linear regression line (line of best fit along with 95%CI) is shown for platelet counts and TEG-MA (heparinase). Correlation coefficient of 0.541 (P < 0.001). TEG: Thromboelastogram.
- Citation: Bhatia AK, Yabrodi M, Carroll M, Bunting S, Kanter K, Maher KO, Deshpande SR. Utility and correlation of known anticoagulation parameters in the management of pediatric ventricular assist devices. World J Cardiol 2017; 9(9): 749-756
- URL: https://www.wjgnet.com/1949-8462/full/v9/i9/749.htm
- DOI: https://dx.doi.org/10.4330/wjc.v9.i9.749


