Copyright
©The Author(s) 2017.
World J Cardiol. Mar 26, 2017; 9(3): 212-229
Published online Mar 26, 2017. doi: 10.4330/wjc.v9.i3.212
Published online Mar 26, 2017. doi: 10.4330/wjc.v9.i3.212
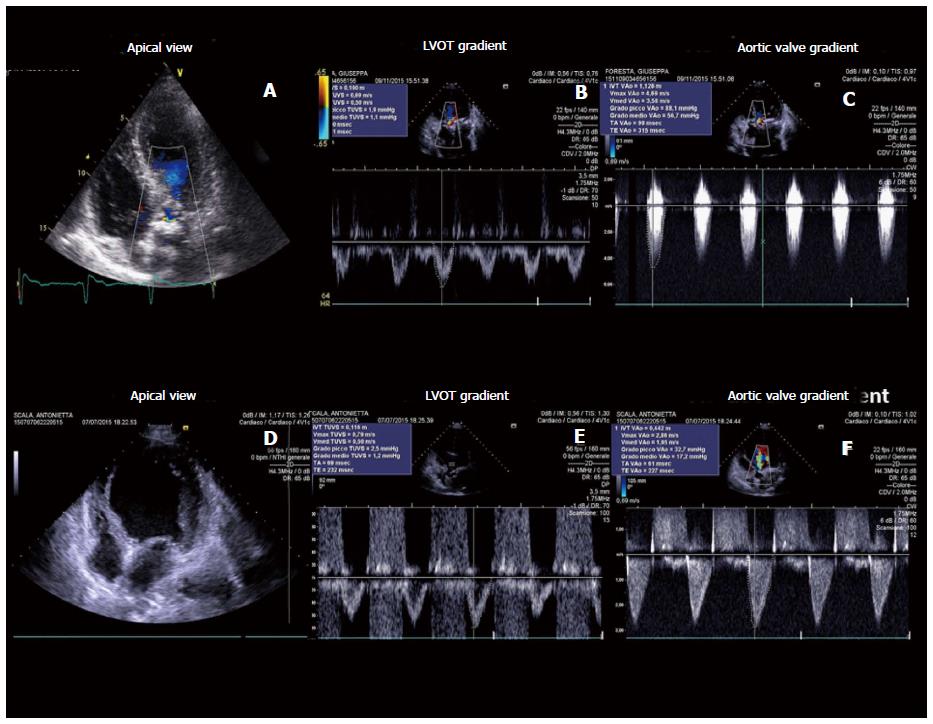
Figure 2 Transthoracic echocardiography gives detailed anatomic description of aortic valve complex and allows to estimate with enough reliability the haemodynamic entity of valvular stenosis by assessment of functional aortic valve area, derived using continuity equation.
Two examples of severe aortic stenosis with normal ejection fraction and gradients (A-C), and with classical “low flow-low gradient” pattern (D-F). LVOT: Left ventricular outflow tract.
- Citation: Cocchia R, D’Andrea A, Conte M, Cavallaro M, Riegler L, Citro R, Sirignano C, Imbriaco M, Cappelli M, Gregorio G, Calabrò R, Bossone E. Patient selection for transcatheter aortic valve replacement: A combined clinical and multimodality imaging approach. World J Cardiol 2017; 9(3): 212-229
- URL: https://www.wjgnet.com/1949-8462/full/v9/i3/212.htm
- DOI: https://dx.doi.org/10.4330/wjc.v9.i3.212


