Copyright
©The Author(s) 2017.
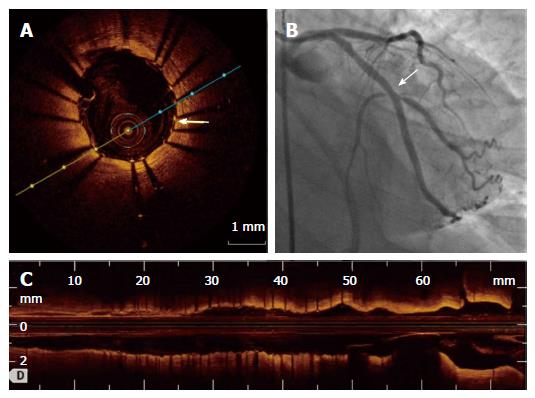
Figure 3 Angiogram and optical coherence tomography images after percutaneous coronary intervention.
A, C: OCT confirming stent expansion and apposition in the cross-sectional (A) and longitudinal (C) lumen reconstruction. Arrow in A highlights good strut apposition to the vessel wall and B is final angiogram. The arrow in B highlights the level of the previous stenosis and the percutaneous coronary intervention success. OCT: Optical coherence tomography.
- Citation: Couture EL, Bérubé S, Daneault B. Optical coherence tomography to identify the cause of an arrhythmic storm: A case report. World J Cardiol 2017; 9(1): 71-75
- URL: https://www.wjgnet.com/1949-8462/full/v9/i1/71.htm
- DOI: https://dx.doi.org/10.4330/wjc.v9.i1.71


