Copyright
©The Author(s) 2017.
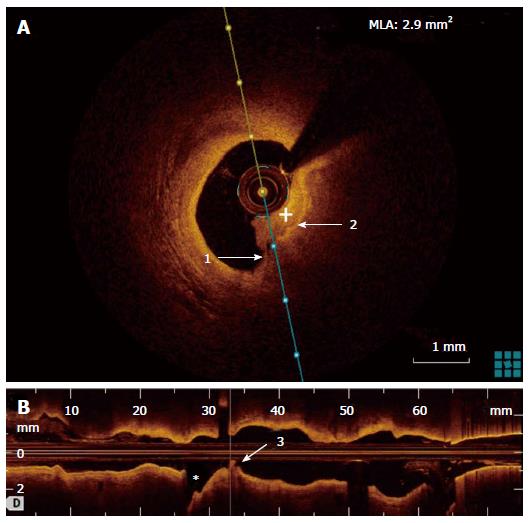
Figure 2 Optical coherence tomography performed during the repeated angiogram.
A: OCT showing cross-section lumen reconstruction at the level of the plaque rupture. An intraluminal non-occlusive thrombus (+) is visualized. Arrow 1 shows rupture thin-cap fibroatheroma as visualized by the loss of continuity of the normal intima show by Arrow 2; B: OCT longitudinal lumen reconstruction at the mid left circumflex artery level. Arrow 3 highlights both plaque rupture and intraluminal thrombus be just before the bifurcation with the first marginal (asterisk). OCT: Optical coherence tomography.
- Citation: Couture EL, Bérubé S, Daneault B. Optical coherence tomography to identify the cause of an arrhythmic storm: A case report. World J Cardiol 2017; 9(1): 71-75
- URL: https://www.wjgnet.com/1949-8462/full/v9/i1/71.htm
- DOI: https://dx.doi.org/10.4330/wjc.v9.i1.71


