Copyright
©The Author(s) 2016.
World J Cardiol. Aug 26, 2016; 8(8): 447-455
Published online Aug 26, 2016. doi: 10.4330/wjc.v8.i8.447
Published online Aug 26, 2016. doi: 10.4330/wjc.v8.i8.447
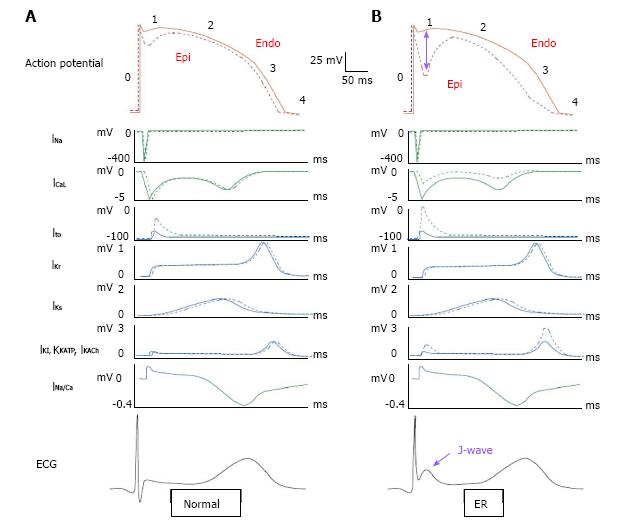
Figure 4 The pathophysiological background of J wave.
A: The normal action potential, underlying currents and corresponding ECGs. Epicardial (Epi) action potential and current are shown by dotted lines and endocardial (Endo) by solid lines. Depolarizing currents are depicted downward in green and repolarizing currents upward in blue. The Epi action potential has a characteristic notch caused by larger phase -1 Ito compared with Endo; B: Exaggeration of the Epi notch results from enhancement of net outward current. Phase-1 current flow from Endo to Epi produces the J-wave. The various ionic mechanisms that are believed to produce ER are shown with purple stars. INa: Inward sodium current; ICaL: Inward calcium currents; INa/Ca: Sodium calcium exchange; Ito: Transient outward current; IKs: Slow delayed rectifier current; IKr: Rapid delayed rectifier current; IK1: Inward rectifier current; IKATP: Adenosine triphosphate-sensitive current; IKACh: Acetylcholine-activated current; ECG: Electrocardiogram.
- Citation: Rizzo C, Monitillo F, Iacoviello M. 12-lead electrocardiogram features of arrhythmic risk: A focus on early repolarization. World J Cardiol 2016; 8(8): 447-455
- URL: https://www.wjgnet.com/1949-8462/full/v8/i8/447.htm
- DOI: https://dx.doi.org/10.4330/wjc.v8.i8.447


