Copyright
©The Author(s) 2016.
World J Cardiol. Feb 26, 2016; 8(2): 220-230
Published online Feb 26, 2016. doi: 10.4330/wjc.v8.i2.220
Published online Feb 26, 2016. doi: 10.4330/wjc.v8.i2.220
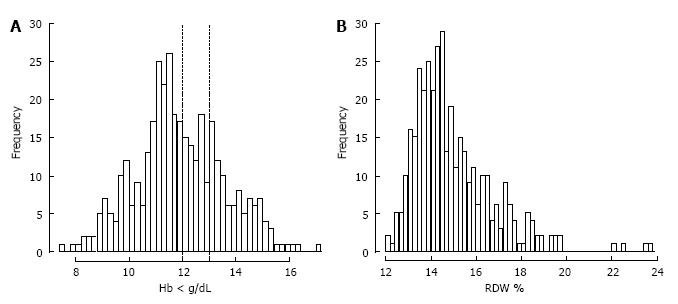
Figure 3 Histogram of the distribution of hemoglobin and red cell distribution width levels.
A: Histogram of the distribution of hemoglobin levels. Vertical lines at 12 g/dL and 13 g/dL for population based cut-off points for women and men according to WHO definition of anemia; B: Histogram of RDW levels. Hb: Hemoglobin; RDW: Red cell distribution width.
- Citation: Hellhammer K, Zeus T, Verde PE, Veulemanns V, Kahlstadt L, Wolff G, Erkens R, Westenfeld R, Navarese EP, Merx MW, Rassaf T, Kelm M. Red cell distribution width in anemic patients undergoing transcatheter aortic valve implantation. World J Cardiol 2016; 8(2): 220-230
- URL: https://www.wjgnet.com/1949-8462/full/v8/i2/220.htm
- DOI: https://dx.doi.org/10.4330/wjc.v8.i2.220


