Copyright
©The Author(s) 2016.
World J Cardiol. Feb 26, 2016; 8(2): 220-230
Published online Feb 26, 2016. doi: 10.4330/wjc.v8.i2.220
Published online Feb 26, 2016. doi: 10.4330/wjc.v8.i2.220
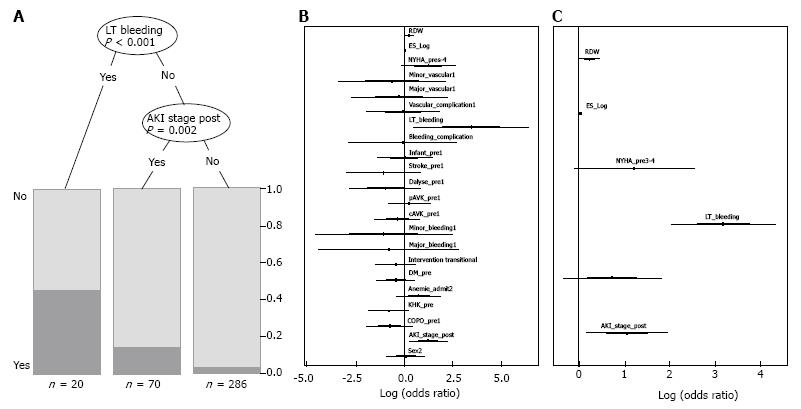
Figure 1 Regression analysis for risk factors associated with 30-d mortality.
A: Results from the classification tree with significant node-splits and distribution of patients. Life-threatening bleeding (P < 0.001) and acute kidney injury (P = 0.002) were found to be statistically relevant risk factors for 30-d mortality; B: Logistic regression with all covariables which were supposed to be associated with 30-d mortality. Forest plot with odds ratios and 95% confidence intervals (logarithmic scale); C: Logistic regression with the best selected covariables using AIC. Life-threatening bleeding (P < 0.001), acute kidney injury post procedure (P = 0.018) and RDW (P = 0.044) were found to be statistically relevant risk factors for 30-dmortality. AIC: Akaike information criterion; AKI stage post: Acute kidney injury stage I-III post; CAD: Coronary artery disease; Cavk: Cerebroarterial vascular disease; COPD: Chronic obstructive pulmonary disease; DM: Diabetes mellitus; ES log: Logistic EuroSCORE; LT bleeding: Life-threatening bleeding; NYHA: New York Heart Association; pAVK: Peripheral vascular disease; RDW: Red cell distribution width.
- Citation: Hellhammer K, Zeus T, Verde PE, Veulemanns V, Kahlstadt L, Wolff G, Erkens R, Westenfeld R, Navarese EP, Merx MW, Rassaf T, Kelm M. Red cell distribution width in anemic patients undergoing transcatheter aortic valve implantation. World J Cardiol 2016; 8(2): 220-230
- URL: https://www.wjgnet.com/1949-8462/full/v8/i2/220.htm
- DOI: https://dx.doi.org/10.4330/wjc.v8.i2.220


