Copyright
©The Author(s) 2016.
World J Cardiol. Feb 26, 2016; 8(2): 146-162
Published online Feb 26, 2016. doi: 10.4330/wjc.v8.i2.146
Published online Feb 26, 2016. doi: 10.4330/wjc.v8.i2.146
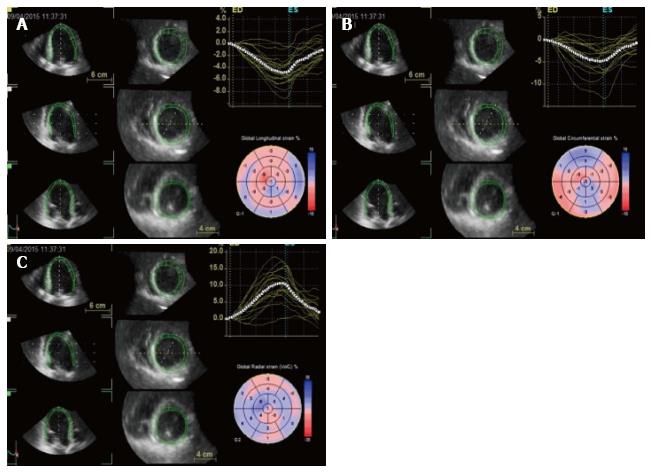
Figure 6 Three dimensional speckle tracking: data sets are displayed in different cross-sections including standard three short-axis views and apical four- and two-chamber views.
The software automatically divides data into 16 standard segments to generate corresponding time–strain curves. Wall motion parameters are simultaneously displayed in particular, the 3 orthogonal strain values (longitudinal strain in A, circumferential strain in B and radial strain in C).
- Citation: Rosa I, Marini C, Stella S, Ancona F, Spartera M, Margonato A, Agricola E. Mechanical dyssynchrony and deformation imaging in patients with functional mitral regurgitation. World J Cardiol 2016; 8(2): 146-162
- URL: https://www.wjgnet.com/1949-8462/full/v8/i2/146.htm
- DOI: https://dx.doi.org/10.4330/wjc.v8.i2.146


