Copyright
©The Author(s) 2015.
World J Cardiol. Sep 26, 2015; 7(9): 571-578
Published online Sep 26, 2015. doi: 10.4330/wjc.v7.i9.571
Published online Sep 26, 2015. doi: 10.4330/wjc.v7.i9.571
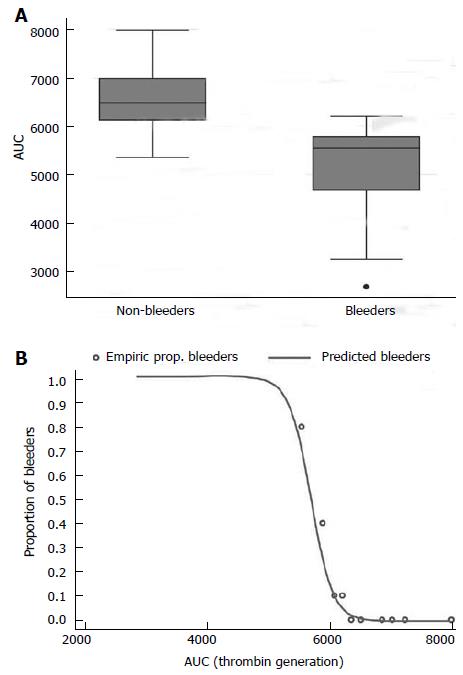
Figure 1 Predictors of bleeding risk.
A: AUC-EXTEM in non-bleeders and in bleeders (patients with major bleeding) (P = 0.0001); B: Bleeding risk prediction and AUC-EXTEM: Each circle represents one decile of the patient population, showing the proportion of patients who bled compared with their mean AUC. The curve is a line of best fit, clearly showing a threshold at an AUC of 6000, below which the bleeding risk increases markedly. AUC: Area-under-curve.
-
Citation: Tarzia V, Bortolussi G, Buratto E, Paolini C, Lin CD, Rizzoli G, Bottio T, Gerosa G. Single
vs double antiplatelet therapy in acute coronary syndrome: Predictors of bleeding after coronary artery bypass grafting. World J Cardiol 2015; 7(9): 571-578 - URL: https://www.wjgnet.com/1949-8462/full/v7/i9/571.htm
- DOI: https://dx.doi.org/10.4330/wjc.v7.i9.571


