Copyright
©The Author(s) 2015.
World J Cardiol. Aug 26, 2015; 7(8): 476-482
Published online Aug 26, 2015. doi: 10.4330/wjc.v7.i8.476
Published online Aug 26, 2015. doi: 10.4330/wjc.v7.i8.476
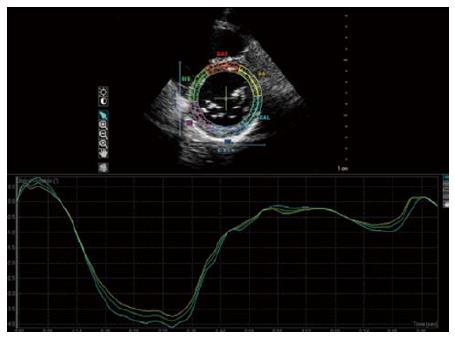
Figure 1 Example of QLAB workstation speckle-tracking analysis.
Upper panel: 2D echo image of the basal left ventricular short axis. The software fully automatically draws the epicardial and endocardial contour of the myocardium. Lower panel: The software calculates the change in angle between the left ventricular (LV) wall and the virtual LV center during the cardiac cycle (green line). The blue and yellow line represent the angulation of the epicardial en endocardial angulation, respectively.
- Citation: Kauer F, Geleijnse ML, Dalen BMV. Role of left ventricular twist mechanics in cardiomyopathies, dance of the helices. World J Cardiol 2015; 7(8): 476-482
- URL: https://www.wjgnet.com/1949-8462/full/v7/i8/476.htm
- DOI: https://dx.doi.org/10.4330/wjc.v7.i8.476


