Copyright
©The Author(s) 2015.
World J Cardiol. Jul 26, 2015; 7(7): 423-430
Published online Jul 26, 2015. doi: 10.4330/wjc.v7.i7.423
Published online Jul 26, 2015. doi: 10.4330/wjc.v7.i7.423
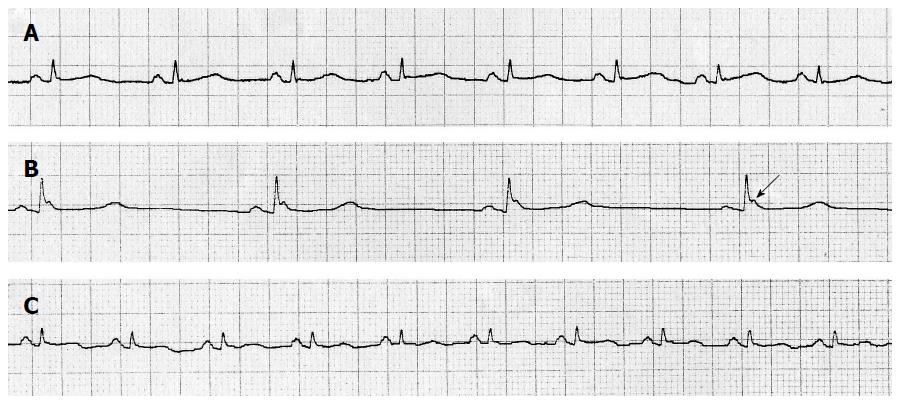
Figure 2 Electrocardiograms in lead II from the same patient.
Reversible prolongation of all electrocardiograms (ECG) intervals may be observed. A: ECG at admission, core temperature was 35.9 °C; B: ECG at peak hypothermia, 33 °C. Osborn or J wave is marked with a black arrow; C: ECG after rewarming, core temperature was 36.4 °C.
- Citation: Salinas P, Lopez-de-Sa E, Pena-Conde L, Viana-Tejedor A, Rey-Blas JR, Armada E, Lopez-Sendon JL. Electrocardiographic changes during induced therapeutic hypothermia in comatose survivors after cardiac arrest. World J Cardiol 2015; 7(7): 423-430
- URL: https://www.wjgnet.com/1949-8462/full/v7/i7/423.htm
- DOI: https://dx.doi.org/10.4330/wjc.v7.i7.423


