Copyright
©The Author(s) 2015.
World J Cardiol. Jul 26, 2015; 7(7): 423-430
Published online Jul 26, 2015. doi: 10.4330/wjc.v7.i7.423
Published online Jul 26, 2015. doi: 10.4330/wjc.v7.i7.423
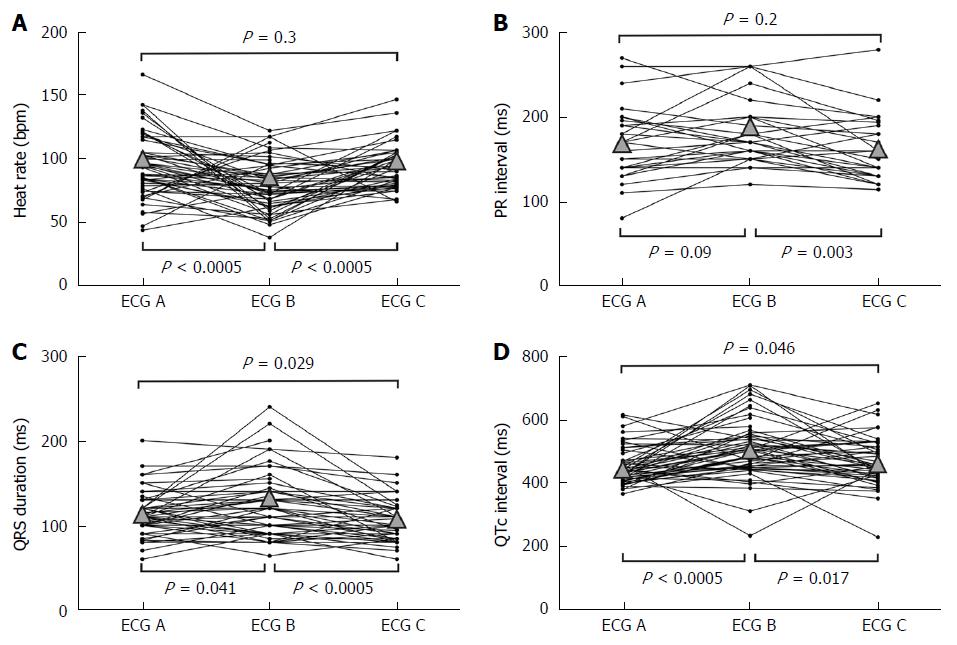
Figure 1 Graphics and statistical significance for paired t-test analyses for related samples.
A: Heart rate (bpm); B: PR interval (ms); C: QRS duration (ms); D: QTc interval (ms). The dark dots are individual values of each single patient. Triangles represent mean values, shown in Table 2. Electrocardiograms (ECG) A represents ECG at admission; ECG B was performed at peak hypothermia and ECG C was recorded after rewarming.
- Citation: Salinas P, Lopez-de-Sa E, Pena-Conde L, Viana-Tejedor A, Rey-Blas JR, Armada E, Lopez-Sendon JL. Electrocardiographic changes during induced therapeutic hypothermia in comatose survivors after cardiac arrest. World J Cardiol 2015; 7(7): 423-430
- URL: https://www.wjgnet.com/1949-8462/full/v7/i7/423.htm
- DOI: https://dx.doi.org/10.4330/wjc.v7.i7.423


