Copyright
©The Author(s) 2015.
World J Cardiol. Jun 26, 2015; 7(6): 351-356
Published online Jun 26, 2015. doi: 10.4330/wjc.v7.i6.351
Published online Jun 26, 2015. doi: 10.4330/wjc.v7.i6.351
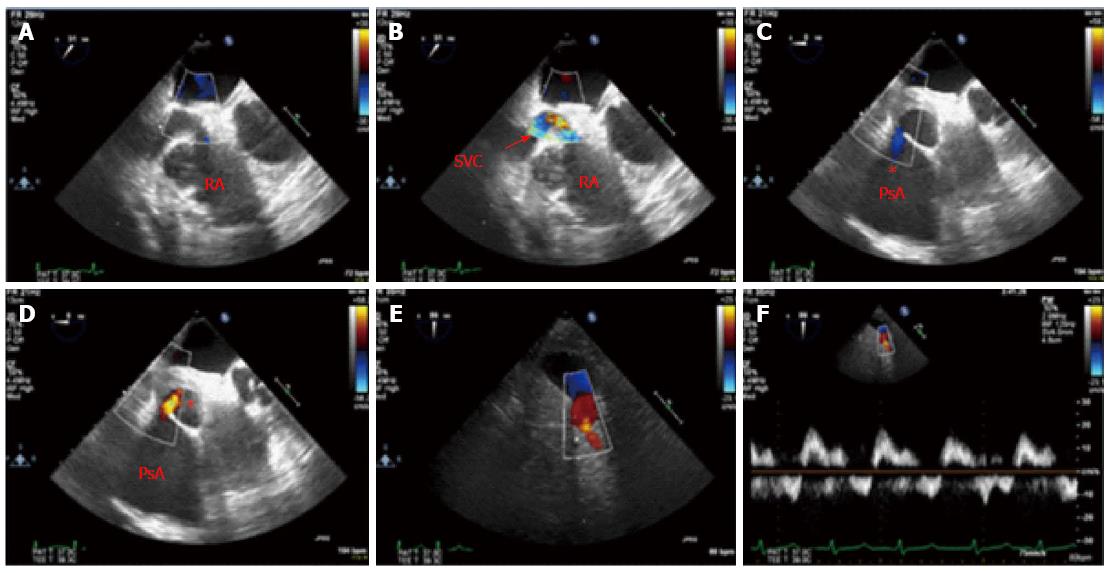
Figure 4 Intraoperative echocardiography showed superior vena cava compression by the giant pseudoaneurysm cranial lobe.
A: Intraoperative transesophageal echocardiogram demonstrated normal left ventricular systolic function with left ventricular ejection fraction 60% and the giant pseudoaneurysm of SVG to RPDA in relation to the cardiac structures; B: Echocardiographic view of the pseudoaneurysm upper lobe compressing the superior vena cava (SVC); C, D: Blood flow by color Doppler of the SVC into the right atrium; E, F: Bidirectional flow is seen between the upper and lower pseudoaneurysm (PsA) lobes during diastole and systole respectively. Color Doppler and flow velocities of the giant pseudoaneurysm caudal lobe. RPDA: Right posterior descending artery.
- Citation: Vargas-Estrada A, Edwards D, Bashir M, Rossen J, Zahr F. Giant saphenous vein graft pseudoaneurysm to right posterior descending artery presenting with superior vena cava syndrome. World J Cardiol 2015; 7(6): 351-356
- URL: https://www.wjgnet.com/1949-8462/full/v7/i6/351.htm
- DOI: https://dx.doi.org/10.4330/wjc.v7.i6.351


