Copyright
©The Author(s) 2015.
World J Cardiol. Dec 26, 2015; 7(12): 948-960
Published online Dec 26, 2015. doi: 10.4330/wjc.v7.i12.948
Published online Dec 26, 2015. doi: 10.4330/wjc.v7.i12.948
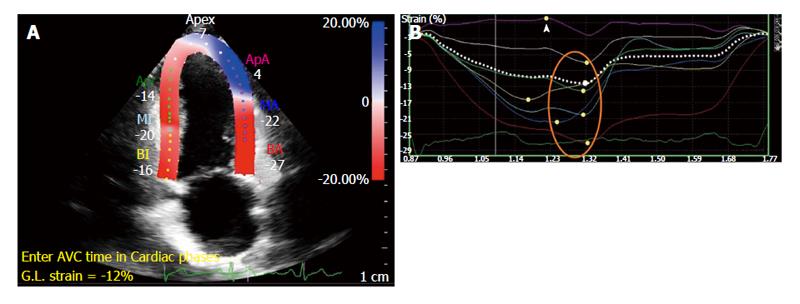
Figure 4 Peak systolic strain calculated by speckle-tracking echocardiography.
A: Segmental strain after definition of endocardial and epicardial contours; B: Graphical illustration of segmental peak systolic strain - normal values annotated by orange circle, impaired strain by arrowhead.
- Citation: Shetye A, Nazir SA, Squire IB, McCann GP. Global myocardial strain assessment by different imaging modalities to predict outcomes after ST-elevation myocardial infarction: A systematic review. World J Cardiol 2015; 7(12): 948-960
- URL: https://www.wjgnet.com/1949-8462/full/v7/i12/948.htm
- DOI: https://dx.doi.org/10.4330/wjc.v7.i12.948


