Copyright
©The Author(s) 2015.
World J Cardiol. Dec 26, 2015; 7(12): 861-874
Published online Dec 26, 2015. doi: 10.4330/wjc.v7.i12.861
Published online Dec 26, 2015. doi: 10.4330/wjc.v7.i12.861
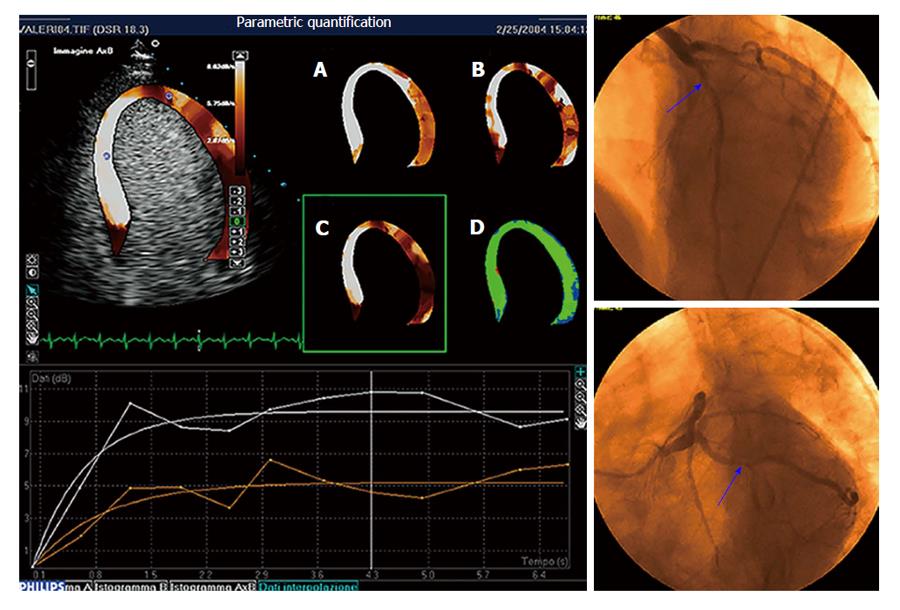
Figure 4 Parametric quantification of myocardial perfusion.
Critical stenosis of the circumflex artery is present at coronary angiography (right panels). Parametric images of peak dipyridamole stress echo reported in panels A through D represent, respectively, the plateau value A of the contrast replenishment curve, the slope β of the replenishment curve, the A ×β value, and the goodness of fitting. The A ×β value parametric imaging is also displayed superimposed onto the apical four-chamber view in the top left panel. Replenishment time-course curves (sampling and interpolation) relative to the septum (white curves) and the apico-lateral wall (red curves) are reported in the graph at the bottom. Flow is reduced in the territory perfused by circumflex artery.
- Citation: Barletta G, Del Bene MR. Myocardial perfusion echocardiography and coronary microvascular dysfunction. World J Cardiol 2015; 7(12): 861-874
- URL: https://www.wjgnet.com/1949-8462/full/v7/i12/861.htm
- DOI: https://dx.doi.org/10.4330/wjc.v7.i12.861


