Copyright
©The Author(s) 2015.
World J Cardiol. Oct 26, 2015; 7(10): 671-684
Published online Oct 26, 2015. doi: 10.4330/wjc.v7.i10.671
Published online Oct 26, 2015. doi: 10.4330/wjc.v7.i10.671
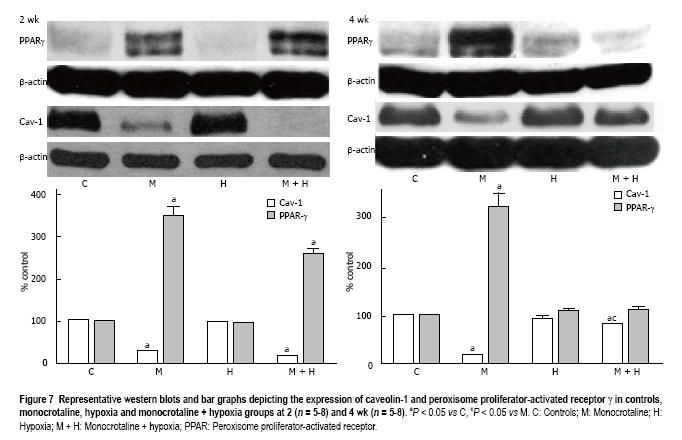
Figure 7 Representative western blots and bar graphs depicting the expression of caveolin-1 and peroxisome proliferator-activated receptor γ in controls, monocrotaline, hypoxia and monocrotaline + hypoxia groups at 2 (n = 5-8) and 4 wk (n = 5-8).
aP < 0.05 vs C, cP < 0.05 vs M. C: Controls; M: Monocrotaline; H: Hypoxia; M + H: Monocrotaline + hypoxia; PPAR: Peroxisome proliferator-activated receptor.
- Citation: Huang J, Wolk JH, Gewitz MH, Loyd JE, West J, Austin ED, Mathew R. Enhanced caveolin-1 expression in smooth muscle cells: Possible prelude to neointima formation. World J Cardiol 2015; 7(10): 671-684
- URL: https://www.wjgnet.com/1949-8462/full/v7/i10/671.htm
- DOI: https://dx.doi.org/10.4330/wjc.v7.i10.671


