Copyright
©2014 Baishideng Publishing Group Inc.
World J Cardiol. Sep 26, 2014; 6(9): 890-907
Published online Sep 26, 2014. doi: 10.4330/wjc.v6.i9.890
Published online Sep 26, 2014. doi: 10.4330/wjc.v6.i9.890
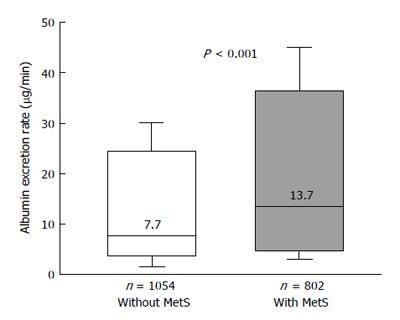
Figure 4 Box plots showing urinary albumin excretion rates in nondiabetic hypertensives participating in the Renal Dysfunction in Hypertension study[39], divided in subjects with and without the metabolic syndrome.
In the Box-and-Whisker plots, the central boxes represent the interquartile range (25th to 75th percentile). The middle lines, and the numbers above these lines, represent the median values. Lower and upper whiskers extend to 5th and 95th percentile. MetS: Metabolic syndrome.
- Citation: Mulè G, Calcaterra I, Nardi E, Cerasola G, Cottone S. Metabolic syndrome in hypertensive patients: An unholy alliance. World J Cardiol 2014; 6(9): 890-907
- URL: https://www.wjgnet.com/1949-8462/full/v6/i9/890.htm
- DOI: https://dx.doi.org/10.4330/wjc.v6.i9.890


