Copyright
©2014 Baishideng Publishing Group Inc.
World J Cardiol. Jul 26, 2014; 6(7): 577-584
Published online Jul 26, 2014. doi: 10.4330/wjc.v6.i7.577
Published online Jul 26, 2014. doi: 10.4330/wjc.v6.i7.577
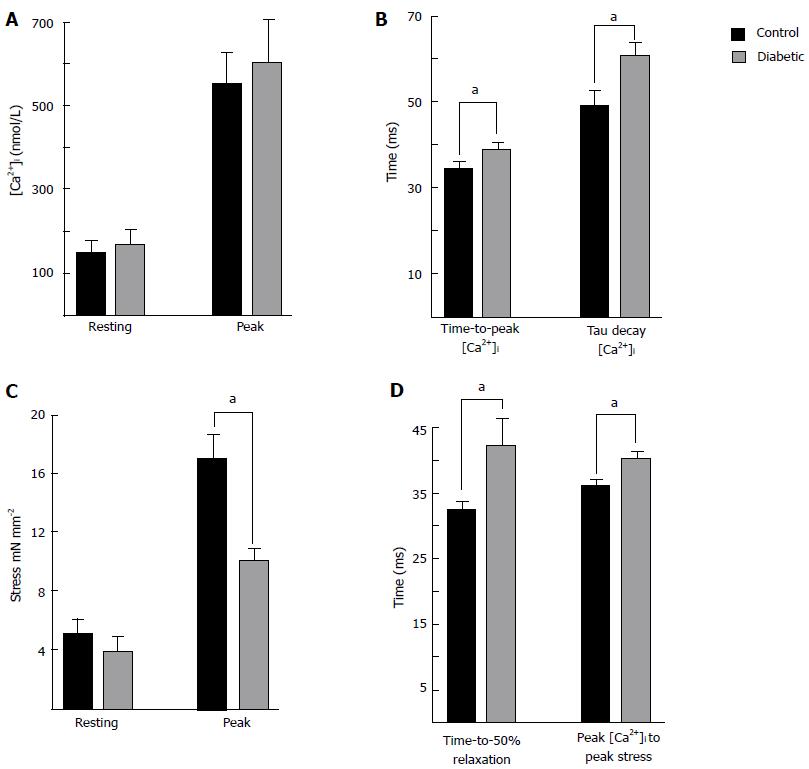
Figure 2 Summary of intracellular Ca2+ and isometric stress parameters.
Data were recorded from left ventricular trabeculae at 37 °C, 5 Hz stimulation frequency, and 1.5 mmoL [Ca2+]o. Data are mean ± SE 8 wk post injection for control (n = 7) and diabetic (n = 8). A: Shows resting and peak [Ca2+]i. The Ca2+ transients were prolonged in diabetic trabecuae; B: Shows the time to reach peak [Ca2+]i, and the time constant of the Ca2+ transient decay; C: Shows no difference in resting stress, but peak stress was reduced in diabetic trabeculae; D: Shows the time to 50% relaxation of stress was prolonged in diabetic, as was the time from the peak of the Ca2+ transient to the peak of the twitch. aP < 0.05, diabetic vs control.
- Citation: Ward ML, Crossman DJ. Mechanisms underlying the impaired contractility of diabetic cardiomyopathy. World J Cardiol 2014; 6(7): 577-584
- URL: https://www.wjgnet.com/1949-8462/full/v6/i7/577.htm
- DOI: https://dx.doi.org/10.4330/wjc.v6.i7.577


