Copyright
©2014 Baishideng Publishing Group Inc.
World J Cardiol. Oct 26, 2014; 6(10): 1067-1079
Published online Oct 26, 2014. doi: 10.4330/wjc.v6.i10.1067
Published online Oct 26, 2014. doi: 10.4330/wjc.v6.i10.1067
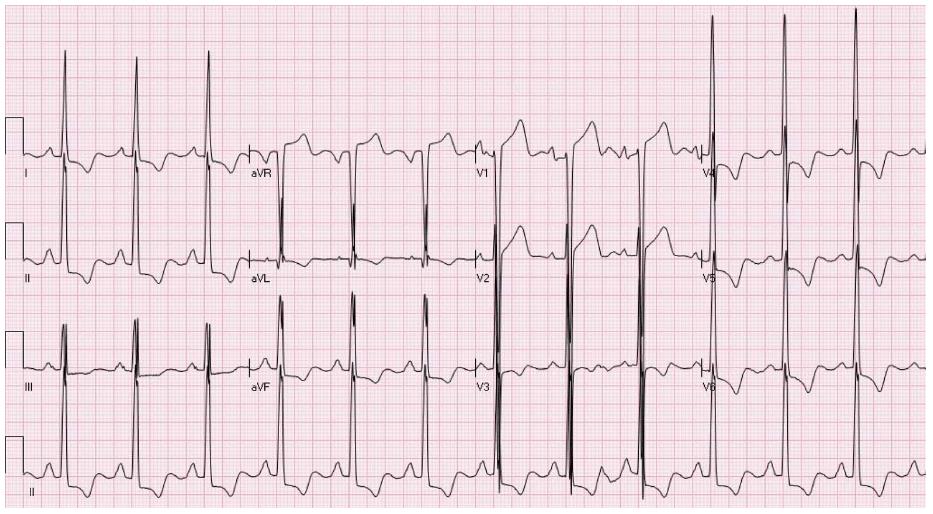
Figure 4 An electrocardiogram showing typical pattern of ST elevation due to hypertrophy of the left ventricular with secondary repolarization changes.
There is ST elevation in leads V1-V2 and ST depression with T wave inversion in the inferolateral leads.
- Citation: Deshpande A, Birnbaum Y. ST-segment elevation: Distinguishing ST elevation myocardial infarction from ST elevation secondary to nonischemic etiologies. World J Cardiol 2014; 6(10): 1067-1079
- URL: https://www.wjgnet.com/1949-8462/full/v6/i10/1067.htm
- DOI: https://dx.doi.org/10.4330/wjc.v6.i10.1067


