Copyright
©2013 Baishideng Publishing Group Co.
World J Cardiol. Dec 26, 2013; 5(12): 444-452
Published online Dec 26, 2013. doi: 10.4330/wjc.v5.i12.444
Published online Dec 26, 2013. doi: 10.4330/wjc.v5.i12.444
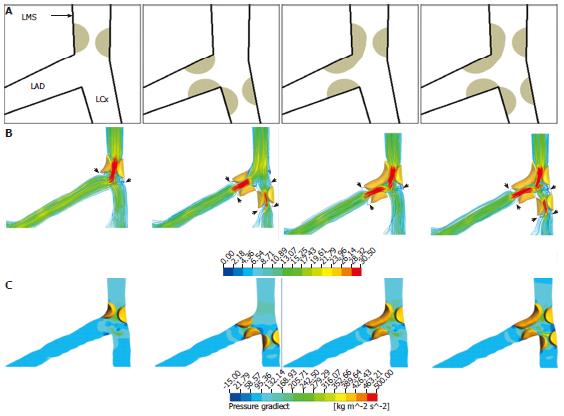
Figure 7 Computational fluid dynamics simulation of left coronary models with measurement of flow velocity and pressure gradient.
A: Diagram shows characterization of the four different types of bifurcation plaques in the left coronary artery; B: The velocity patterns inside left bifurcation at effective plaque locations with these types of bifurcation plaques during the diastolic phase (0.7 s); C: The pressure gradient patterns inside left bifurcation at plaque locations with different types of bifurcation plaques during the systolic phase (0.2 s) (C). Arrows refer to the flow changes in the location of plaques. It is noticed that high velocity and high pressure gradient are present in the models with more plaques formed in the left coronary artery branches. LMS: Left main stem; LAD: Left anterior descending; LCx: Left circumflex.
- Citation: Sun Z. Coronary CT angiography: Beyond morphological stenosis analysis. World J Cardiol 2013; 5(12): 444-452
- URL: https://www.wjgnet.com/1949-8462/full/v5/i12/444.htm
- DOI: https://dx.doi.org/10.4330/wjc.v5.i12.444


