Copyright
©2013 Baishideng Publishing Group Co.
World J Cardiol. Dec 26, 2013; 5(12): 444-452
Published online Dec 26, 2013. doi: 10.4330/wjc.v5.i12.444
Published online Dec 26, 2013. doi: 10.4330/wjc.v5.i12.444
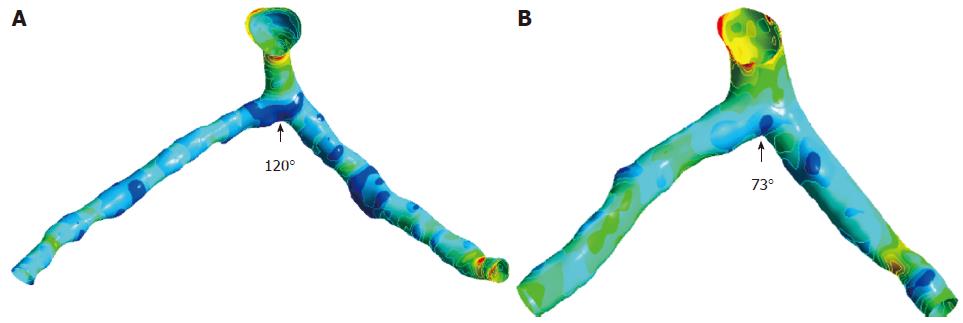
Figure 6 Wall shear stress gradient observed with different angles of the realistic left coronary artery models generated from coronary computed tomography angiography at peak systolic phase of 0.
4 s. The arrows display the wall shear stress gradient distributions, with a large region of the low magnitude present at present at a 120° model (A) and a small region at a 73° model (B).
- Citation: Sun Z. Coronary CT angiography: Beyond morphological stenosis analysis. World J Cardiol 2013; 5(12): 444-452
- URL: https://www.wjgnet.com/1949-8462/full/v5/i12/444.htm
- DOI: https://dx.doi.org/10.4330/wjc.v5.i12.444


