Copyright
©2013 Baishideng Publishing Group Co.
World J Cardiol. Dec 26, 2013; 5(12): 444-452
Published online Dec 26, 2013. doi: 10.4330/wjc.v5.i12.444
Published online Dec 26, 2013. doi: 10.4330/wjc.v5.i12.444
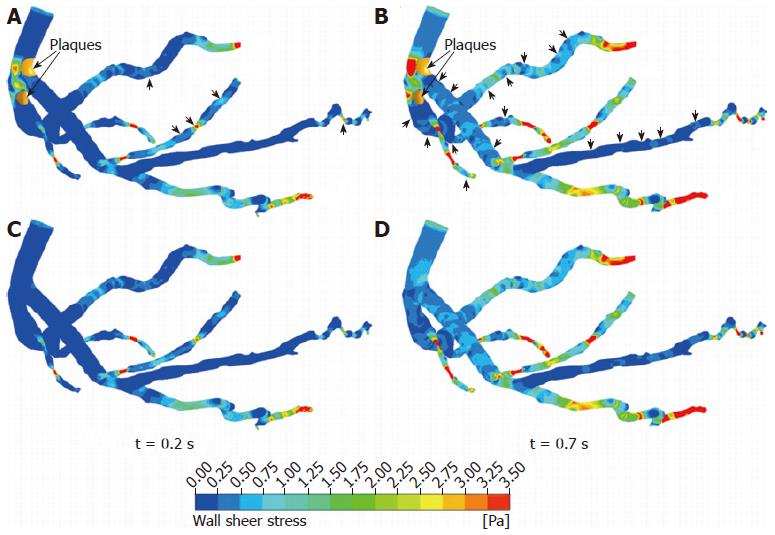
Figure 5 Computational fluid dynamics analysis of wall shear stress in 3D realistic models generated from coronary computed tomography angiography during systolic phase of 0.
2 s and diastolic phase of 0.7 s. A, B: Coronary models with presence of plaques in the left anterior descending; C, D: Computational fluid dynamics analysis simulation in coronary models without presence of plaques. Arrows indicate the effect of plaques locations on wall shear stress changes in coronary side branches in the post-plaques-conditions.
- Citation: Sun Z. Coronary CT angiography: Beyond morphological stenosis analysis. World J Cardiol 2013; 5(12): 444-452
- URL: https://www.wjgnet.com/1949-8462/full/v5/i12/444.htm
- DOI: https://dx.doi.org/10.4330/wjc.v5.i12.444


