Copyright
©2013 Baishideng Publishing Group Co.
World J Cardiol. Dec 26, 2013; 5(12): 444-452
Published online Dec 26, 2013. doi: 10.4330/wjc.v5.i12.444
Published online Dec 26, 2013. doi: 10.4330/wjc.v5.i12.444
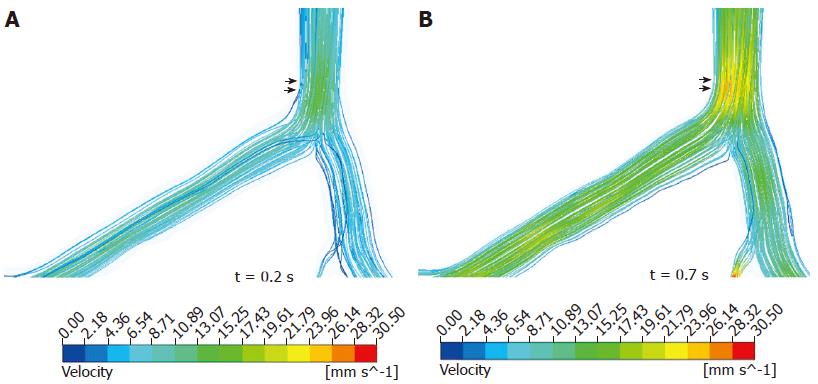
Figure 4 Local impact of flow velocity observed in a normal coronary model during systolic phase of 0.
2 s (A) and diastolic phase of 0.7 s (B). Double arrows reveal high flow velocity locations at bifurcation in the left coronary artery model.
- Citation: Sun Z. Coronary CT angiography: Beyond morphological stenosis analysis. World J Cardiol 2013; 5(12): 444-452
- URL: https://www.wjgnet.com/1949-8462/full/v5/i12/444.htm
- DOI: https://dx.doi.org/10.4330/wjc.v5.i12.444


