Copyright
©2013 Baishideng Publishing Group Co.
World J Cardiol. Nov 26, 2013; 5(11): 404-409
Published online Nov 26, 2013. doi: 10.4330/wjc.v5.i11.404
Published online Nov 26, 2013. doi: 10.4330/wjc.v5.i11.404
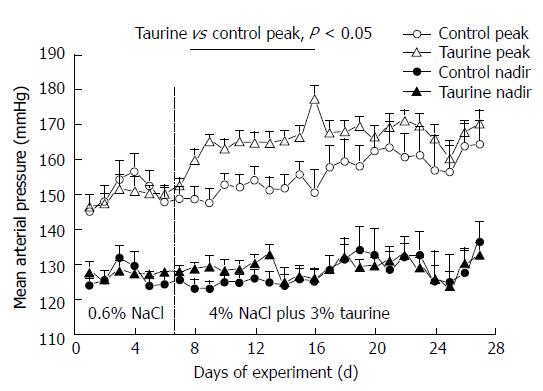
Figure 3 Peak (open symbols) and nadir (closed symbols) mean arterial pressures in control (n = 7) and taurine treated (n = 12) groups.
The vertical dashed line at day 7 indicates the day that the high NaCl diet and taurine supplementation began. Statistical comparisons were performed by one-way analysis of variance and post hoc Duncan’s multiple range test.
- Citation: Suwanich A, Wyss JM, Roysommuti S. Taurine supplementation in spontaneously hypertensive rats: Advantages and limitations for human applications. World J Cardiol 2013; 5(11): 404-409
- URL: https://www.wjgnet.com/1949-8462/full/v5/i11/404.htm
- DOI: https://dx.doi.org/10.4330/wjc.v5.i11.404


