Copyright
©2012 Baishideng Publishing Group Co.
World J Cardiol. May 26, 2012; 4(5): 188-194
Published online May 26, 2012. doi: 10.4330/wjc.v4.i5.188
Published online May 26, 2012. doi: 10.4330/wjc.v4.i5.188
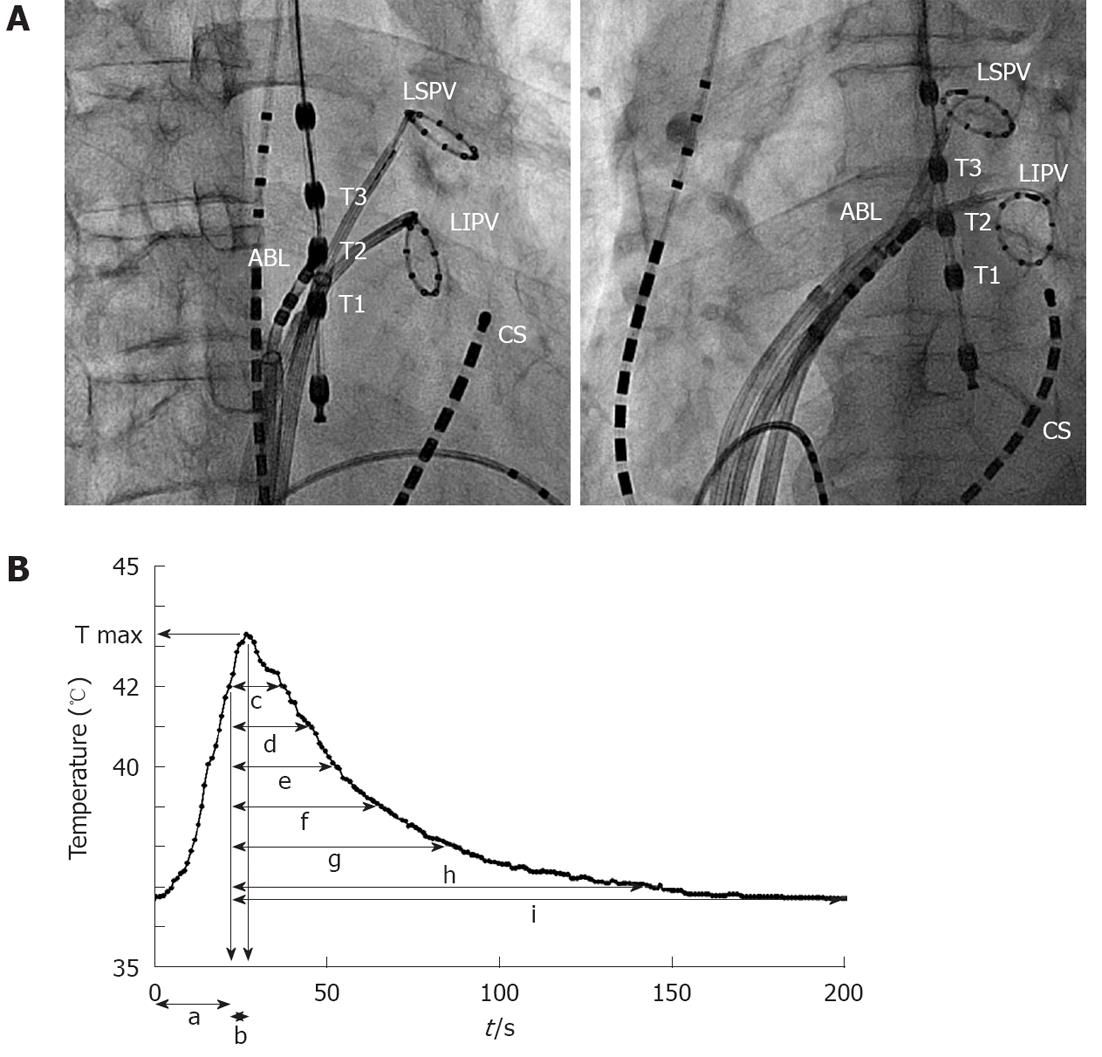
Figure 2 Position of ablation catheter (A) (left: right anterior oblique, right: left anterior oblique) and luminal esophageal temperature monitoring graph (B).
We measured the time when luminal esophageal temperature (LET) reached the cut-off temperature (a), the maximum temperature (T max) of LET, the time to reach T max after the LET reached 42 °C (b) and the time to come back from the delivery of energy end to 42 °C (c), 41 °C (d), 40 °C (e), 39 °C (f), 38 °C (g) and 37 °C (h), and the temperature before the delivery of energy (i). LSPV: Left superior pulmonary vein; LIPV: Left inferior pulmonary vein; RSPV: Right superior pulmonary vein; RIPV: Right inferior pulmonary vein.
- Citation: Sato D, Teramoto K, Kitajima H, Nishina N, Kida Y, Mani H, Esato M, Chun YH, Iwasaka T. Measuring luminal esophageal temperature during pulmonary vein isolation of atrial fibrillation. World J Cardiol 2012; 4(5): 188-194
- URL: https://www.wjgnet.com/1949-8462/full/v4/i5/188.htm
- DOI: https://dx.doi.org/10.4330/wjc.v4.i5.188


