Copyright
©2010 Baishideng Publishing Group Co.
World J Cardiol. Jul 26, 2010; 2(7): 163-170
Published online Jul 26, 2010. doi: 10.4330/wjc.v2.i7.163
Published online Jul 26, 2010. doi: 10.4330/wjc.v2.i7.163
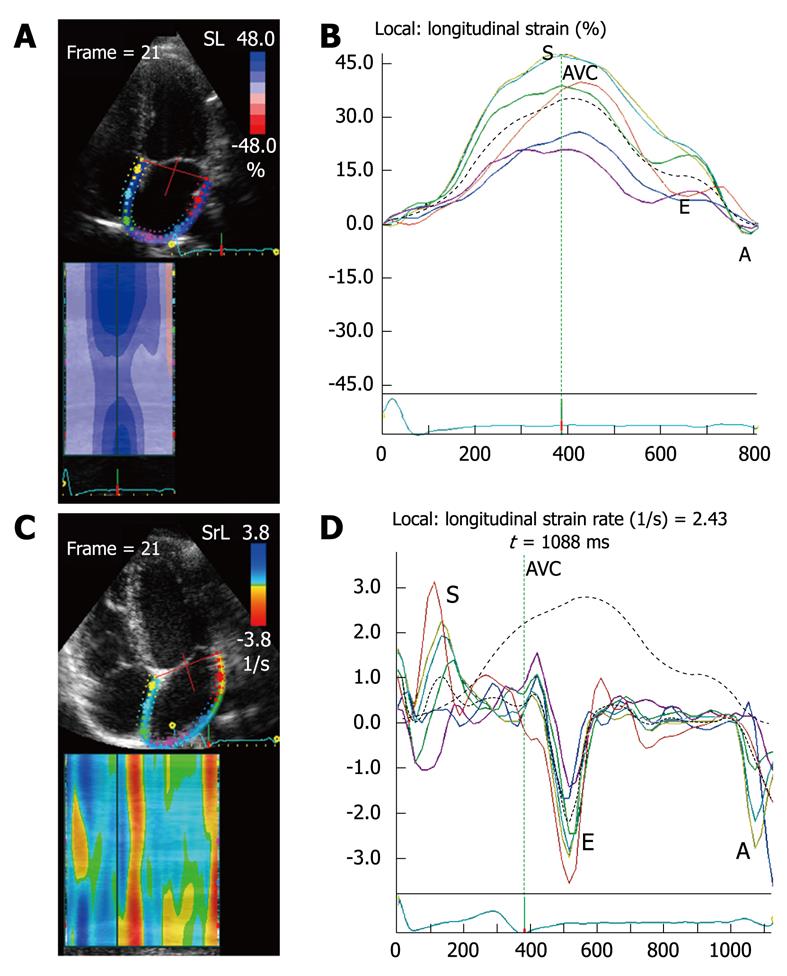
Figure 6 2D longitudinal strain and strain rate of the left atrium obtained from the apical four-chamber view in a normal subject.
Quad view. A: Left atrial speckle tracking and curved anatomical M-mode of atrial strain during the whole cardiac cycle; B: Atrial strain curves depicted with different colors in the six segments (the dotted line indicates average strain). Positive curves indicate the atrial strain of the reservoir during ventricular systole (S), which coincides with aortic valve closure; Negative curves represent atrial strain during early diastole (E), and peak atrial contraction (A) occurs just after the P wave of the ECG; C and D: Similar to A and B: showing the left atrial longitudinal strain rate (SR) (the dotted line indicates the average SR). Positive curves (S), indicate atrial lengthening (relaxation) during the periods of: isovolumic contraction, ventricular ejection and isovolumic relaxation (reservoir SR). Negative curves indicate atrial SR during rapid ventricular filling (E) and atrial systolic SR (A) is seen after the P wave of the ECG. AVC: Aortic valve closure.
- Citation: Cianciulli TF, Saccheri MC, Lax JA, Bermann AM, Ferreiro DE. Two-dimensional speckle tracking echocardiography for the assessment of atrial function. World J Cardiol 2010; 2(7): 163-170
- URL: https://www.wjgnet.com/1949-8462/full/v2/i7/163.htm
- DOI: https://dx.doi.org/10.4330/wjc.v2.i7.163


