Copyright
©2010 Baishideng Publishing Group Co.
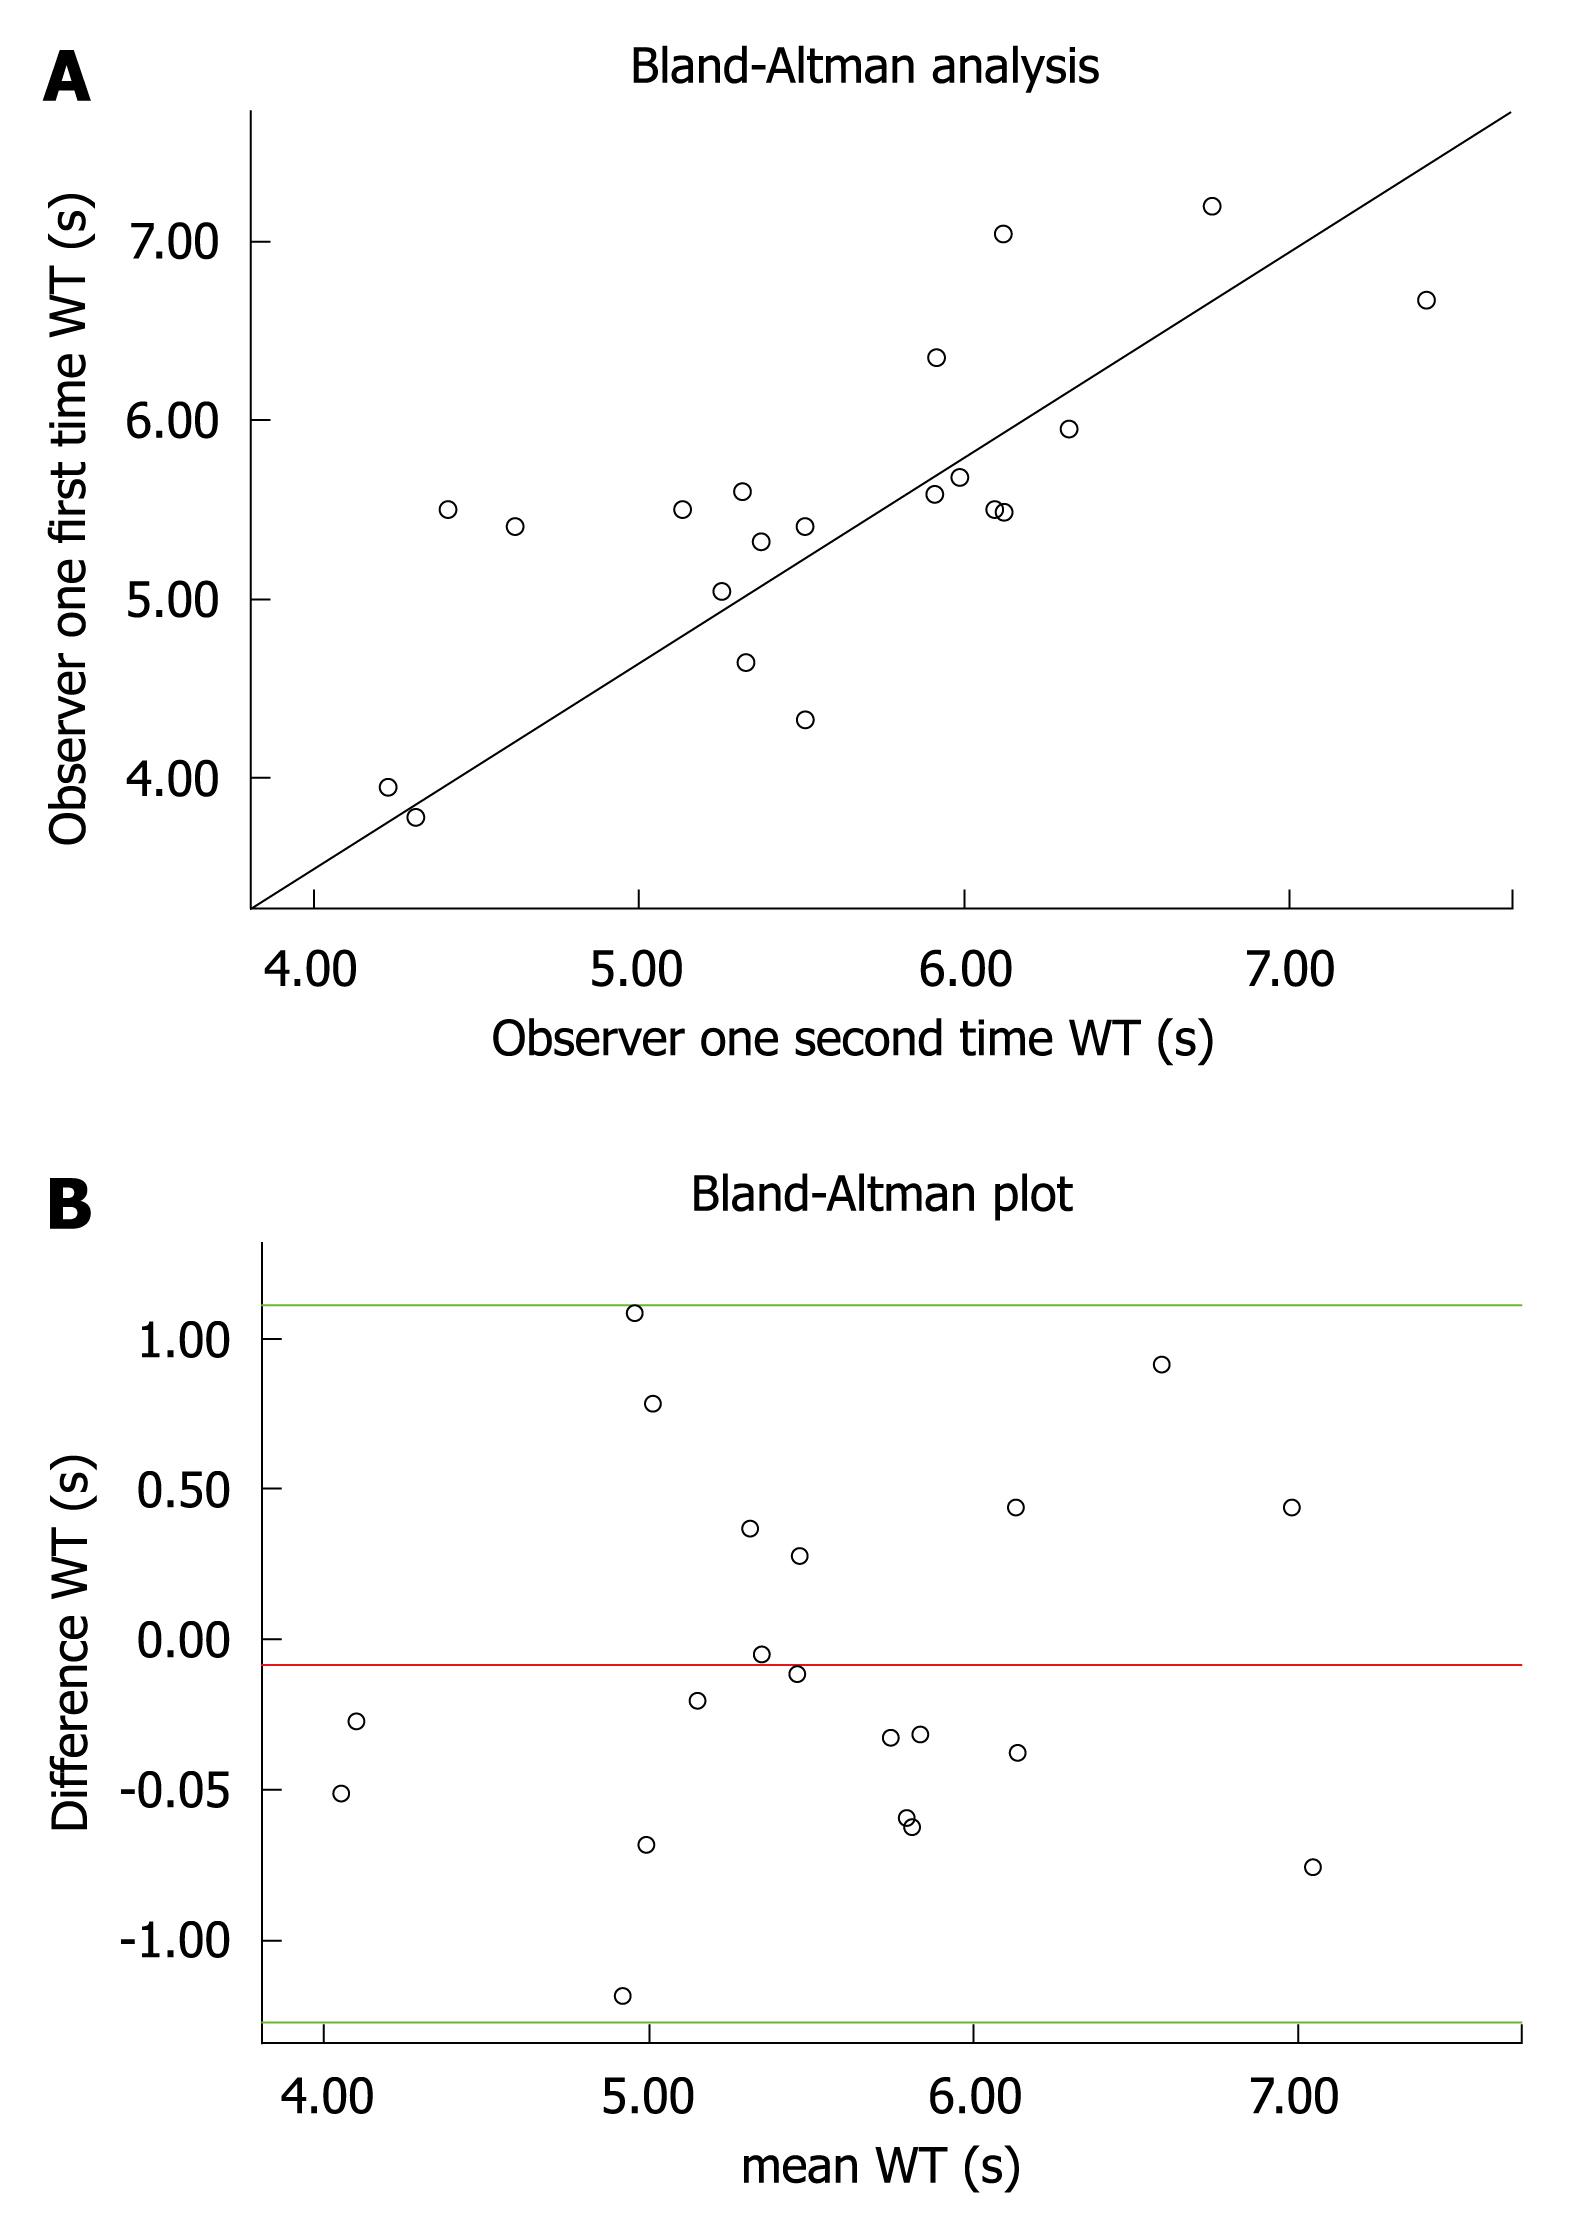
Figure 5 Data for WT measurements and intra-observer agreement.
A: Scatterplot of WT measurements (s) shows data for second time (x-axis) and first time (y-axis) measurement of observer 1; line of perfect agreement is shown; B: Agreement plot for WT measurements made by observer 1. Plots the difference between 2 measurements and mean measurements. Top and bottom lines show the 95% limits of agreement; middle line shows mean difference.
- Citation: Huang PT, Chen CC, Aronow WS, Wang XT, Nair CK, Xue NY, Shen X, Li SY, Huang FG, Cosgrove D. Assessment of neovascularization within carotid plaques in patients with ischemic stroke. World J Cardiol 2010; 2(4): 89-97
- URL: https://www.wjgnet.com/1949-8462/full/v2/i4/89.htm
- DOI: https://dx.doi.org/10.4330/wjc.v2.i4.89


