Copyright
©The Author(s) 2024.
World J Cardiol. Feb 26, 2024; 16(2): 80-91
Published online Feb 26, 2024. doi: 10.4330/wjc.v16.i2.80
Published online Feb 26, 2024. doi: 10.4330/wjc.v16.i2.80
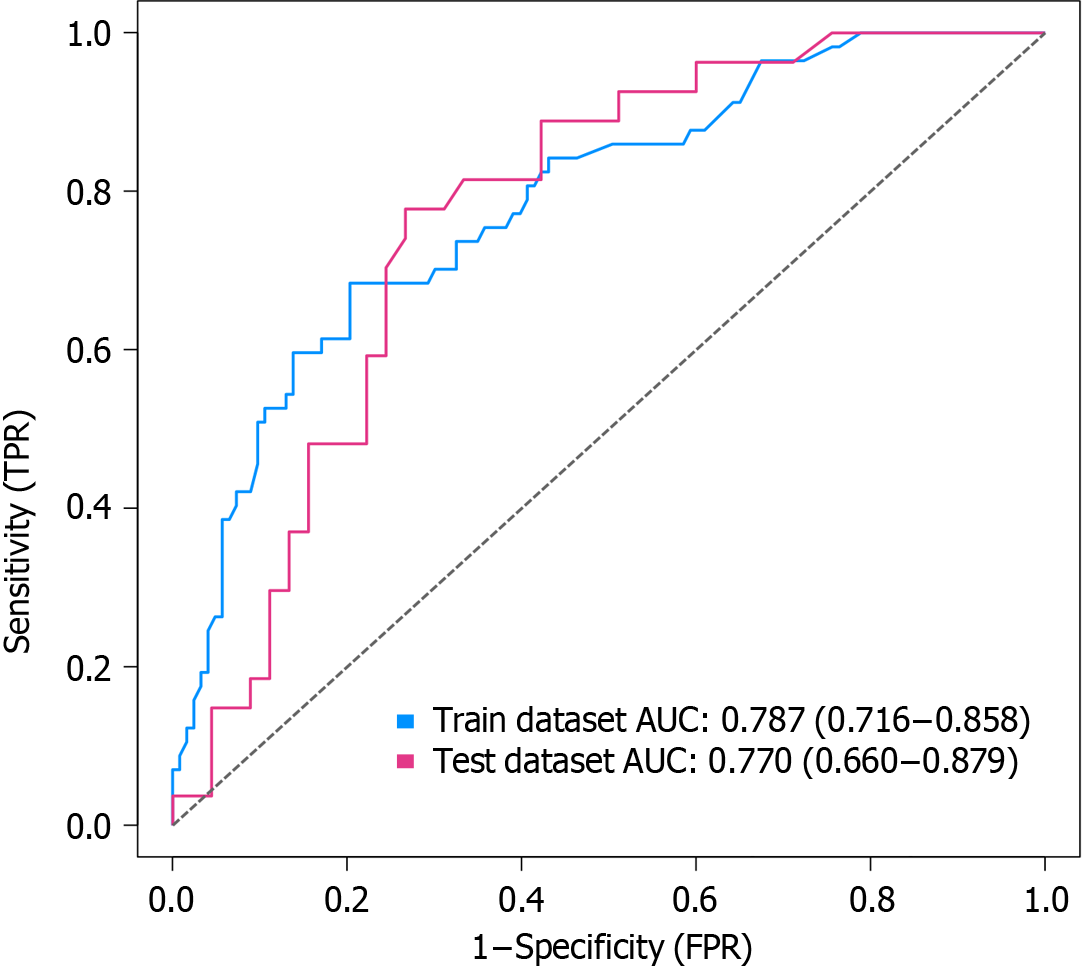
Figure 2 Receiver operating characteristic curve analysis of the nomogram model.
The figure displays the receiver operating characteristic (ROC) curve analysis of the developed nomogram model. The area under the ROC curve (AUC) is used as a measure of the model's discriminatory ability. The false positive rate is plotted on the x-axis, while the true positive rate is plotted on the y-axis. The AUC values indicate the accuracy of the model in distinguishing between individuals who experienced pre-hospital delay and those who did not. A higher AUC value suggests a better predictive performance of the model. TPR: True positive rate; FPR: False positive rate.
- Citation: Cao JY, Zhang LX, Zhou XJ. Development and validation of a nomogram model for predicting the risk of pre-hospital delay in patients with acute myocardial infarction. World J Cardiol 2024; 16(2): 80-91
- URL: https://www.wjgnet.com/1949-8462/full/v16/i2/80.htm
- DOI: https://dx.doi.org/10.4330/wjc.v16.i2.80


