Copyright
©The Author(s) 2024.
World J Cardiol. Oct 26, 2024; 16(10): 564-573
Published online Oct 26, 2024. doi: 10.4330/wjc.v16.i10.564
Published online Oct 26, 2024. doi: 10.4330/wjc.v16.i10.564
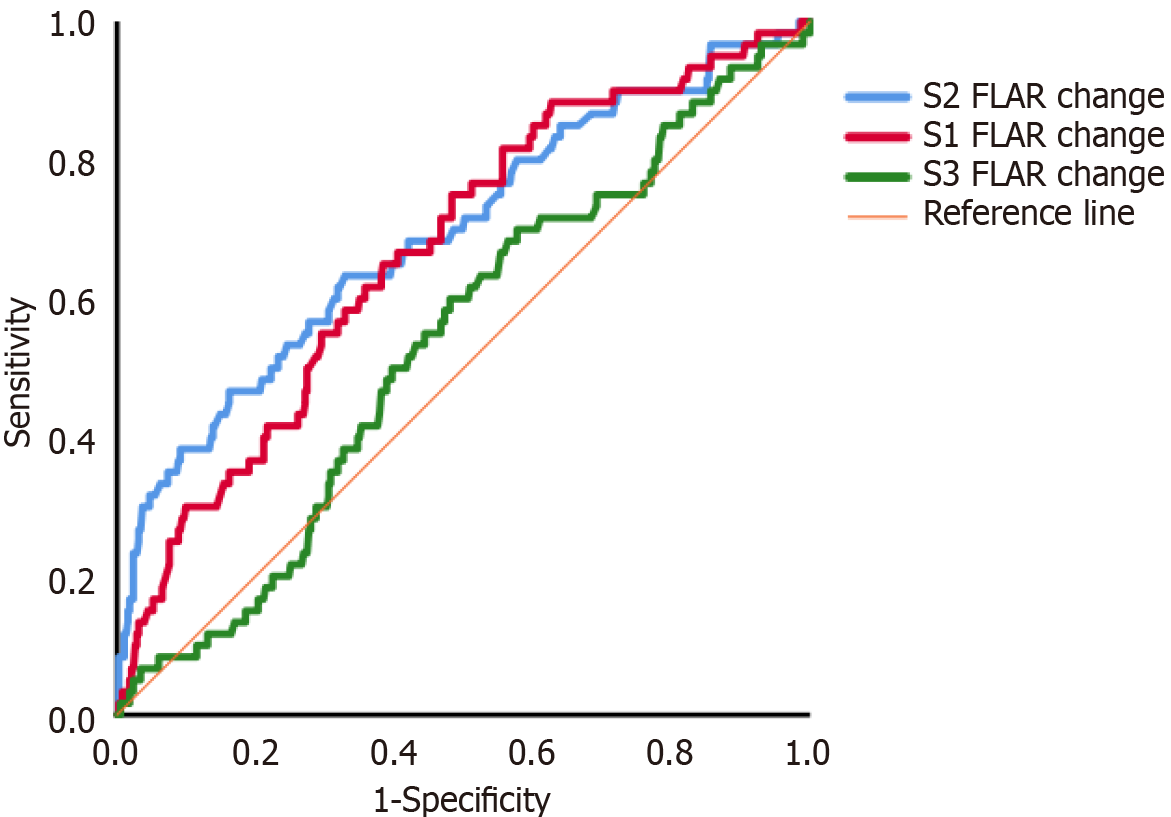
Figure 4 Receiver operating characteristic curve analysis of changes in the false lumen area ratio in segments of the descending aorta and the prediction of renal replacement therapy.
The results of receiver operating characteristic curve analysis of the postoperative/preoperative false lumen area ratio (FLAR) for the prediction of renal replacement therapy were: S1, 0.668 (95%CI: 0.595-0.741, P < 0.001); S2, 0.693 (95%CI: 0.615-0.771, P < 0.001); and S3, 0.535 (95%CI: 0.459-0.610, P = 0.387). S1: Thoracic segment; S2: Upper abdominal segment; S3: Lower abdominal segment.
- Citation: Jiang Q, Yu T, Huang KL, Liu K, Li X, Hu SS. Carotid versus axillary artery cannulation for descending aorta remodeling in type A acute aortic dissection. World J Cardiol 2024; 16(10): 564-573
- URL: https://www.wjgnet.com/1949-8462/full/v16/i10/564.htm
- DOI: https://dx.doi.org/10.4330/wjc.v16.i10.564


