Copyright
©The Author(s) 2024.
World J Cardiol. Oct 26, 2024; 16(10): 564-573
Published online Oct 26, 2024. doi: 10.4330/wjc.v16.i10.564
Published online Oct 26, 2024. doi: 10.4330/wjc.v16.i10.564
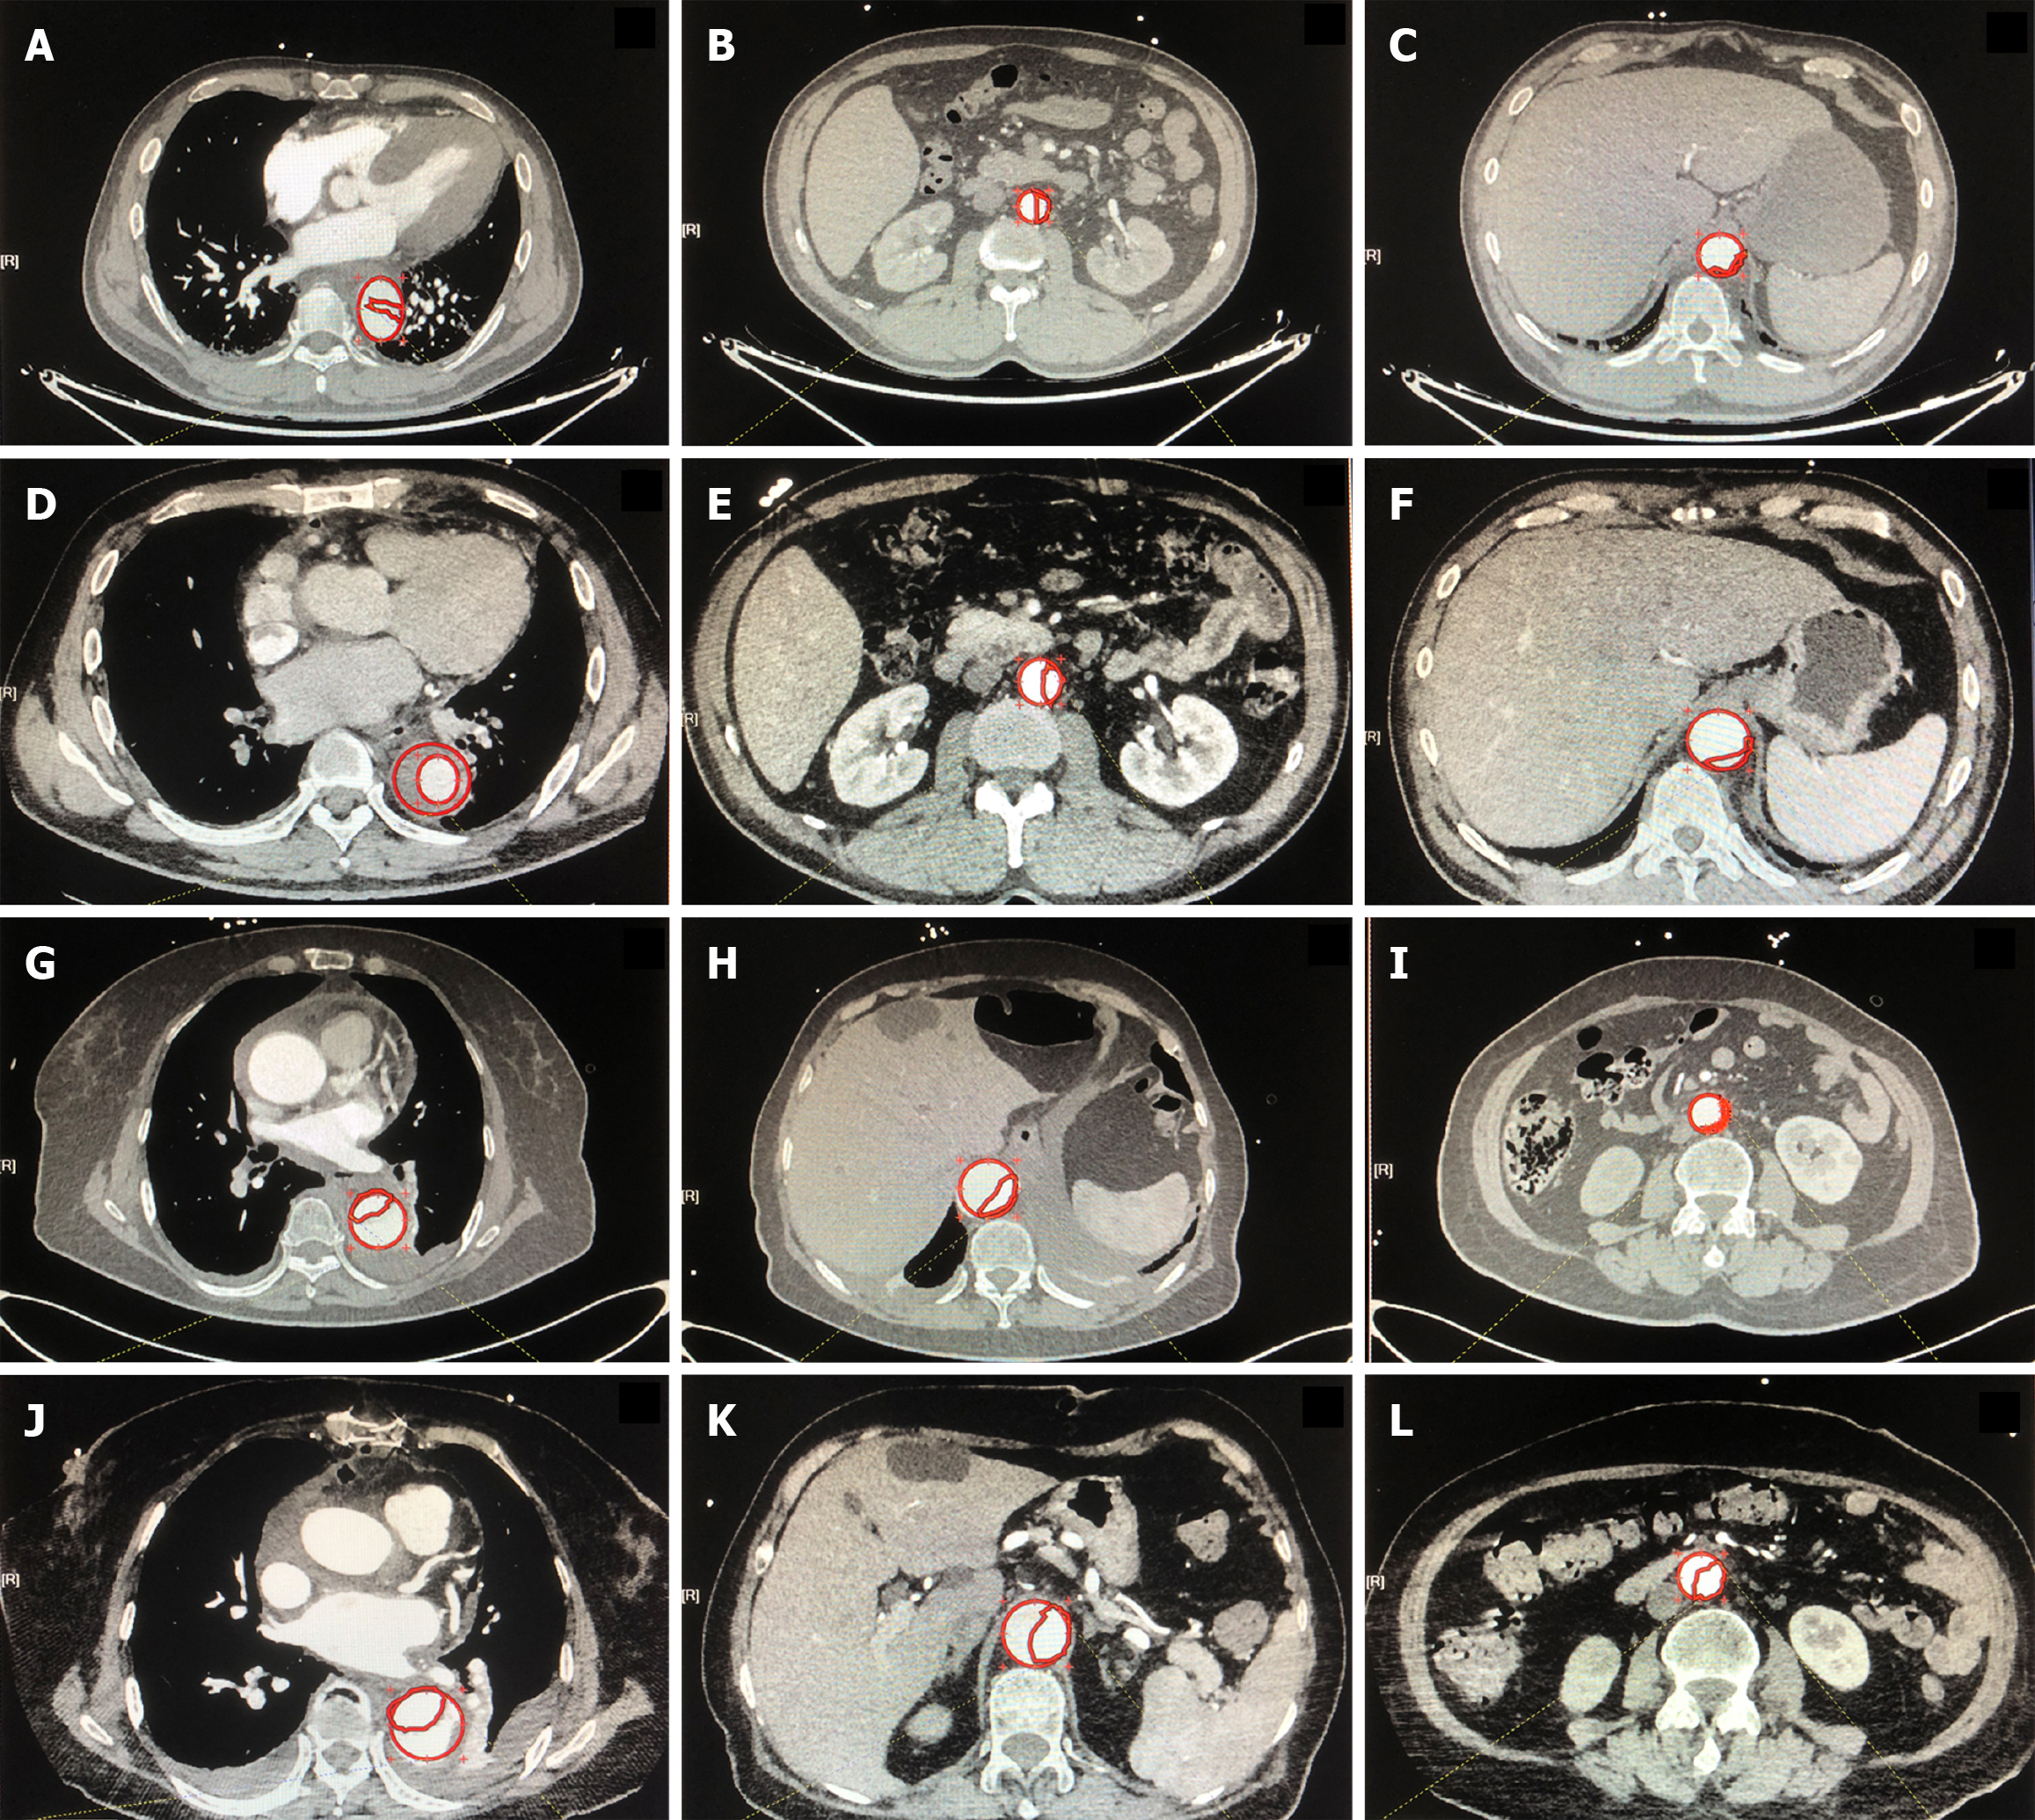
Figure 3 Typical preoperative and postoperative imaging for the false lumen area ratio in the descending aorta of the axillary artery and carotid artery groups by computed tomography angiography.
A-F: Typical preoperative and postoperative imaging of the false lumen area ratio (FLAR) in S1 (A and D), S2 (B and E) and S3 (C and F) in the CA group; G-L: Typical preoperative and postoperative imaging of FLAR in S1 (G and J), S2 (H and K) and S3 (I and L) in the AA group. False lumen area was defined as the traced area of the whole aorta (full line) minus the traced area of the true lumen (dotted line). S1: Thoracic segment; S2: Upper abdominal segment; S3: Lower abdominal segment.
- Citation: Jiang Q, Yu T, Huang KL, Liu K, Li X, Hu SS. Carotid versus axillary artery cannulation for descending aorta remodeling in type A acute aortic dissection. World J Cardiol 2024; 16(10): 564-573
- URL: https://www.wjgnet.com/1949-8462/full/v16/i10/564.htm
- DOI: https://dx.doi.org/10.4330/wjc.v16.i10.564


