Copyright
©The Author(s) 2024.
World J Cardiol. Oct 26, 2024; 16(10): 564-573
Published online Oct 26, 2024. doi: 10.4330/wjc.v16.i10.564
Published online Oct 26, 2024. doi: 10.4330/wjc.v16.i10.564
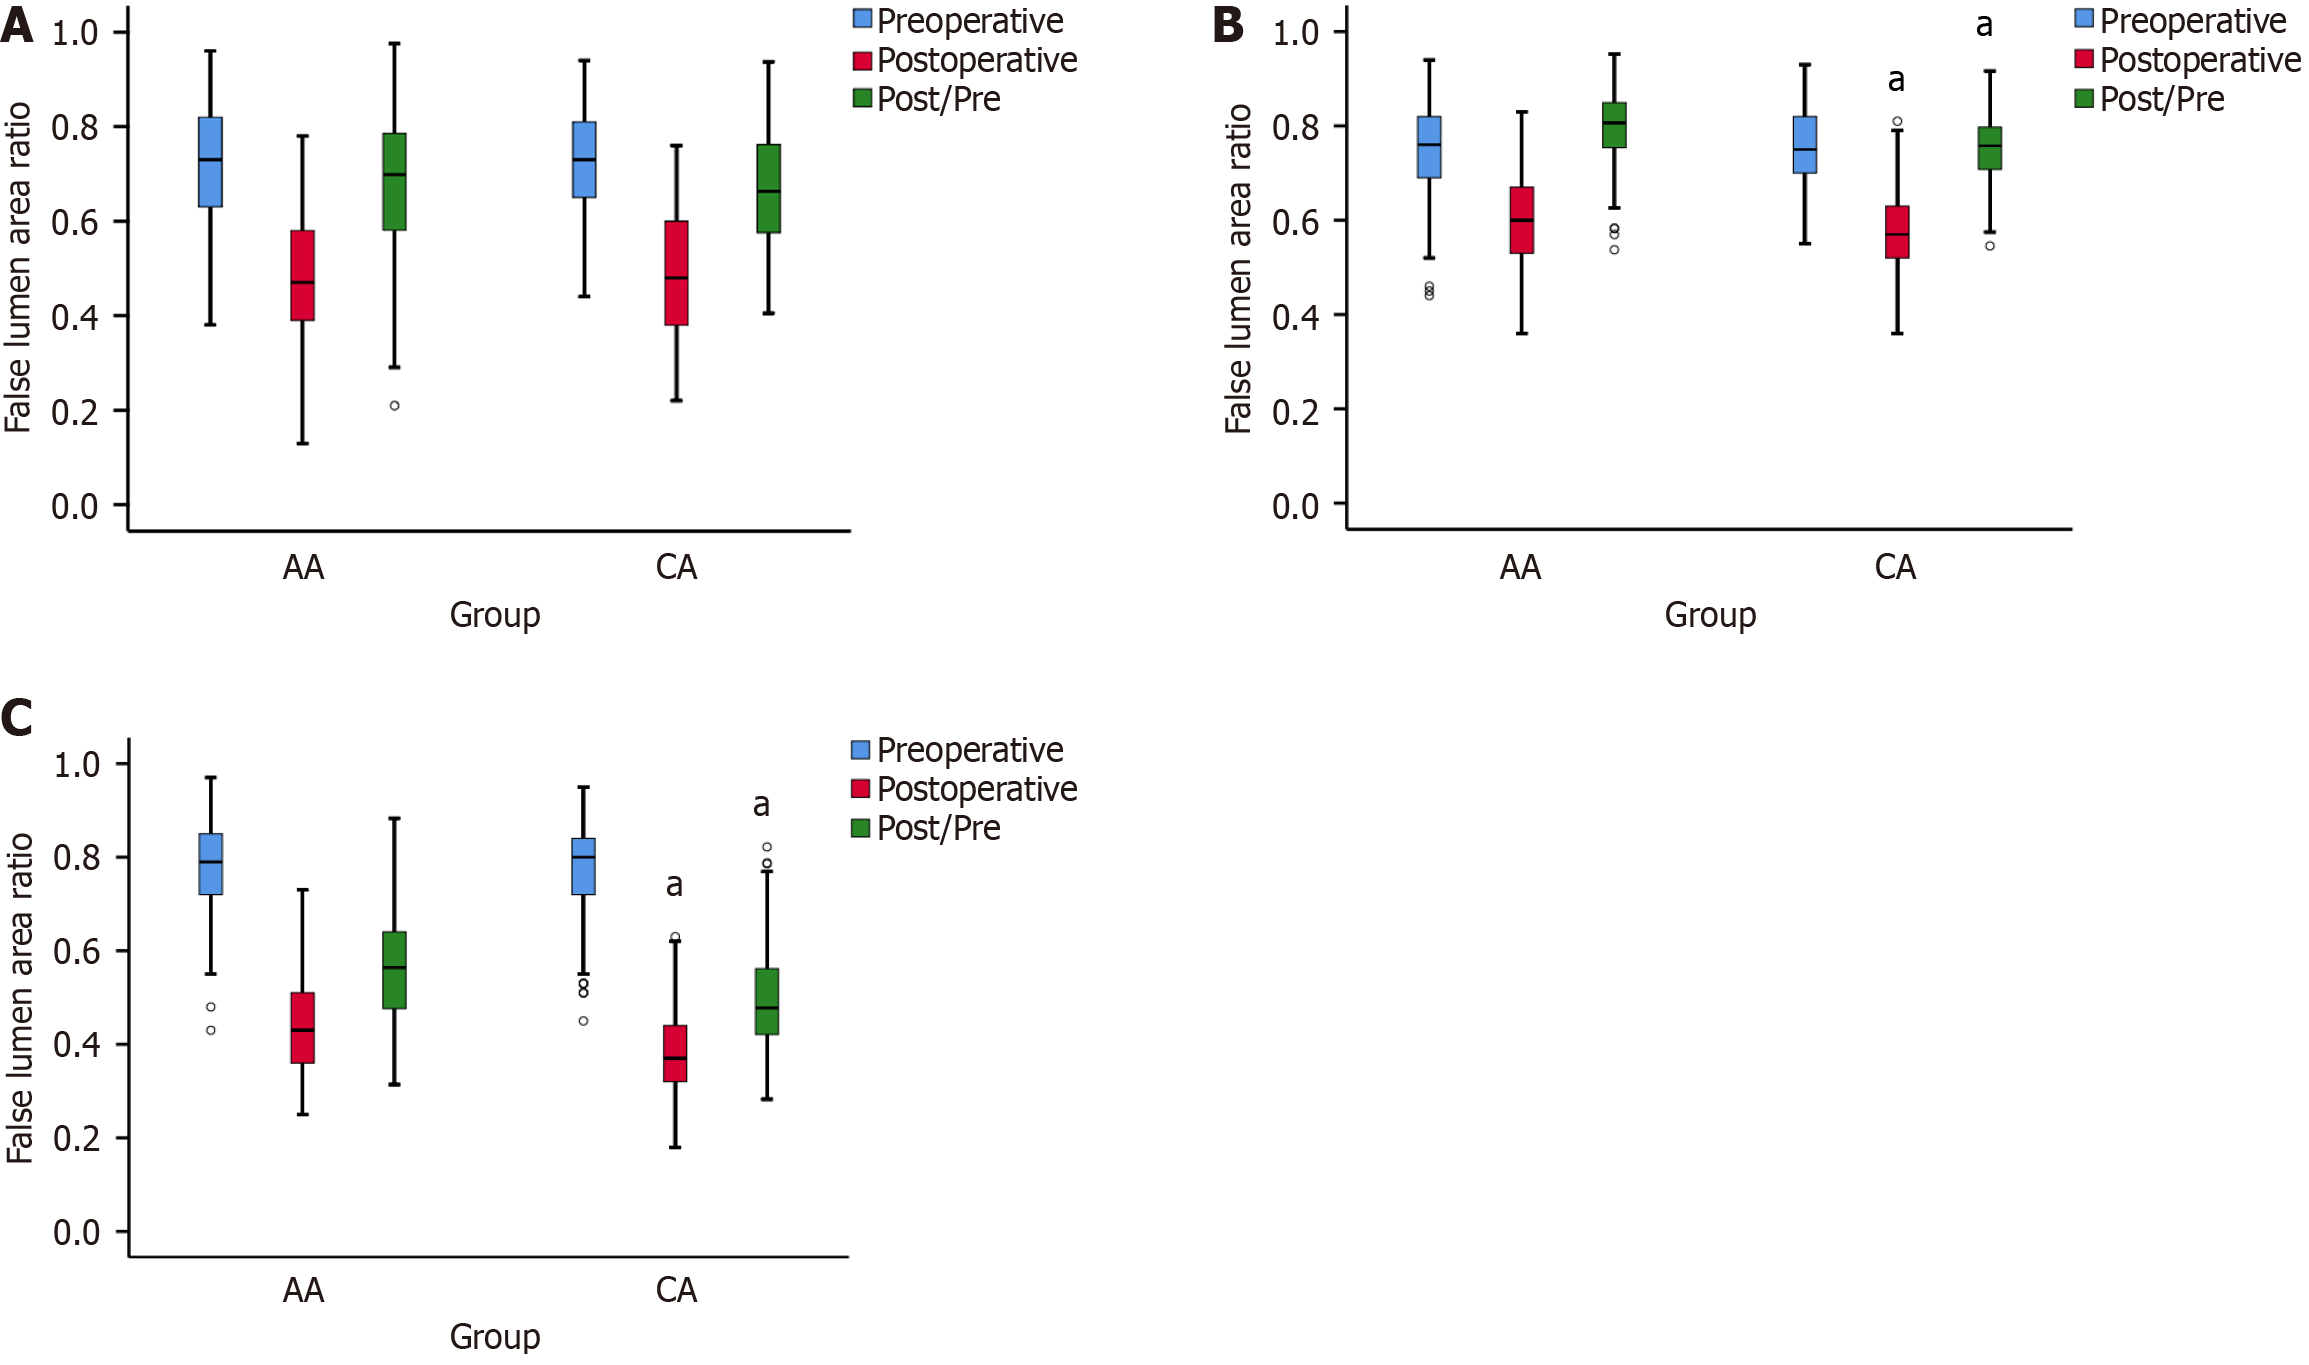
Figure 2 Segment changes in the false lumen area ratio in the descending aorta of the axillary artery and carotid artery groups calculated by computed tomography angiography.
A: The preoperative (left), postoperative (middle), and postoperative/preoperative (right) false lumen area ratio (FLAR) of the S1; B and C: S2 and S3 segments in the AA and CA groups. S1: Thoracic segment; S2: Upper abdominal segment; S3: Lower abdominal segment. aIndicates a significant difference between the two groups (P < 0.01).
- Citation: Jiang Q, Yu T, Huang KL, Liu K, Li X, Hu SS. Carotid versus axillary artery cannulation for descending aorta remodeling in type A acute aortic dissection. World J Cardiol 2024; 16(10): 564-573
- URL: https://www.wjgnet.com/1949-8462/full/v16/i10/564.htm
- DOI: https://dx.doi.org/10.4330/wjc.v16.i10.564


