Copyright
©The Author(s) 2023.
World J Cardiol. Jun 26, 2023; 15(6): 293-308
Published online Jun 26, 2023. doi: 10.4330/wjc.v15.i6.293
Published online Jun 26, 2023. doi: 10.4330/wjc.v15.i6.293
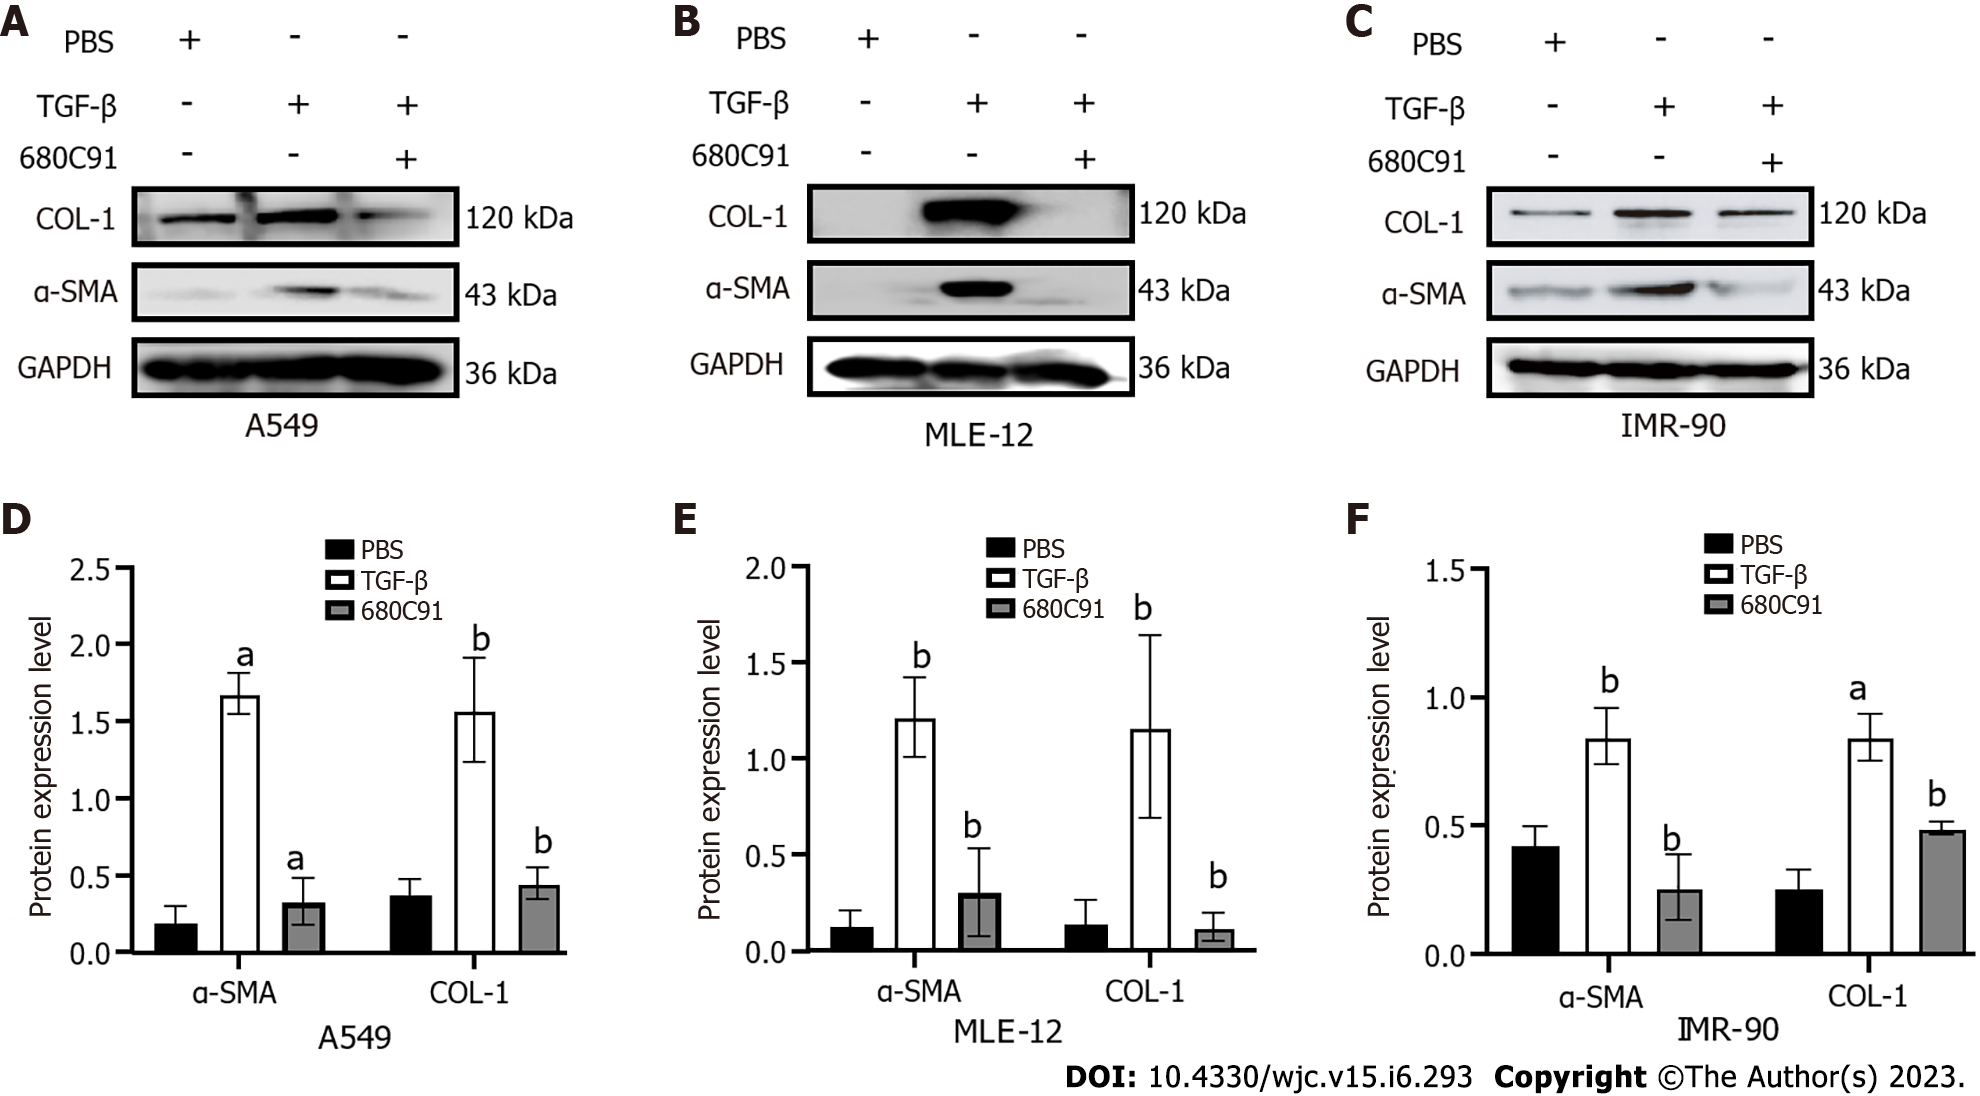
Figure 8 Western blot analysis of α-smooth muscle actin and COL-1 in A549, MLE-12, and IMR-90 cells.
Western blot quantification results in A549, MLE-12 and IMR-90 cells. A and D: A549; B and E: MLE-12; C and F: IMR-90. In line with the homogeneity of variance, the least significance difference method was used when assuming homogeneity of variance. aP < 0.01 vs phosphate-buffered saline; bP < 0.05 vs transforming growth factor-β. PBS: Phosphate-buffered saline; α-SMA: α-smooth muscle actin; TGF-β: Transforming growth factor-β.
- Citation: Wang R, Yang YM. Identification of potential biomarkers for idiopathic pulmonary fibrosis and validation of TDO2 as a potential therapeutic target. World J Cardiol 2023; 15(6): 293-308
- URL: https://www.wjgnet.com/1949-8462/full/v15/i6/293.htm
- DOI: https://dx.doi.org/10.4330/wjc.v15.i6.293


