Copyright
©The Author(s) 2023.
World J Cardiol. Jun 26, 2023; 15(6): 293-308
Published online Jun 26, 2023. doi: 10.4330/wjc.v15.i6.293
Published online Jun 26, 2023. doi: 10.4330/wjc.v15.i6.293
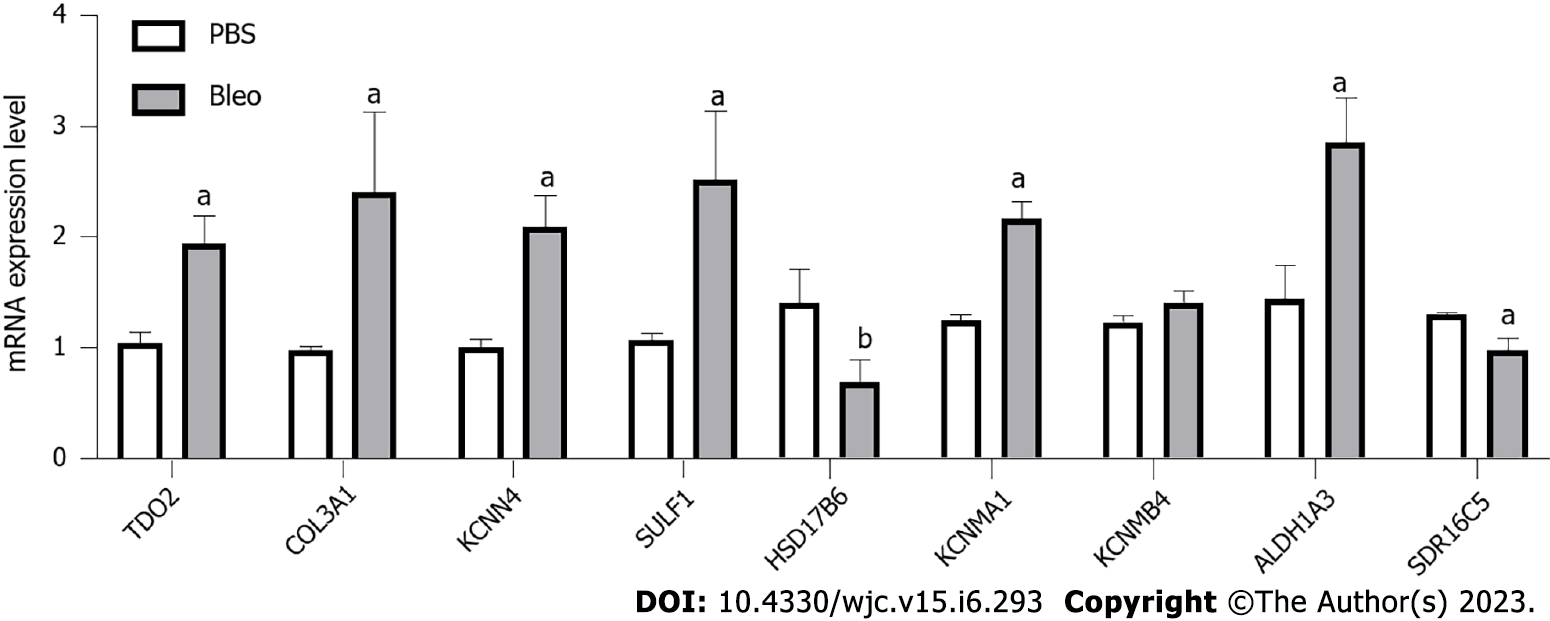
Figure 5 mRNA expression levels of TDO2, COL3A1, KCNN4, SULF1, HSD17B6, KCNMA1, KCNMB4, ALDH1A3, and SDR16C5 in the lung tissue vs PBS (n = 5 for PBS group, n = 5 for Bleo group).
The statistical test used was the t test. Data are expressed as the mean with SD. aP < 0.01, bP < 0.05.
- Citation: Wang R, Yang YM. Identification of potential biomarkers for idiopathic pulmonary fibrosis and validation of TDO2 as a potential therapeutic target. World J Cardiol 2023; 15(6): 293-308
- URL: https://www.wjgnet.com/1949-8462/full/v15/i6/293.htm
- DOI: https://dx.doi.org/10.4330/wjc.v15.i6.293


