Copyright
©The Author(s) 2023.
World J Cardiol. Oct 26, 2023; 15(10): 508-517
Published online Oct 26, 2023. doi: 10.4330/wjc.v15.i10.508
Published online Oct 26, 2023. doi: 10.4330/wjc.v15.i10.508
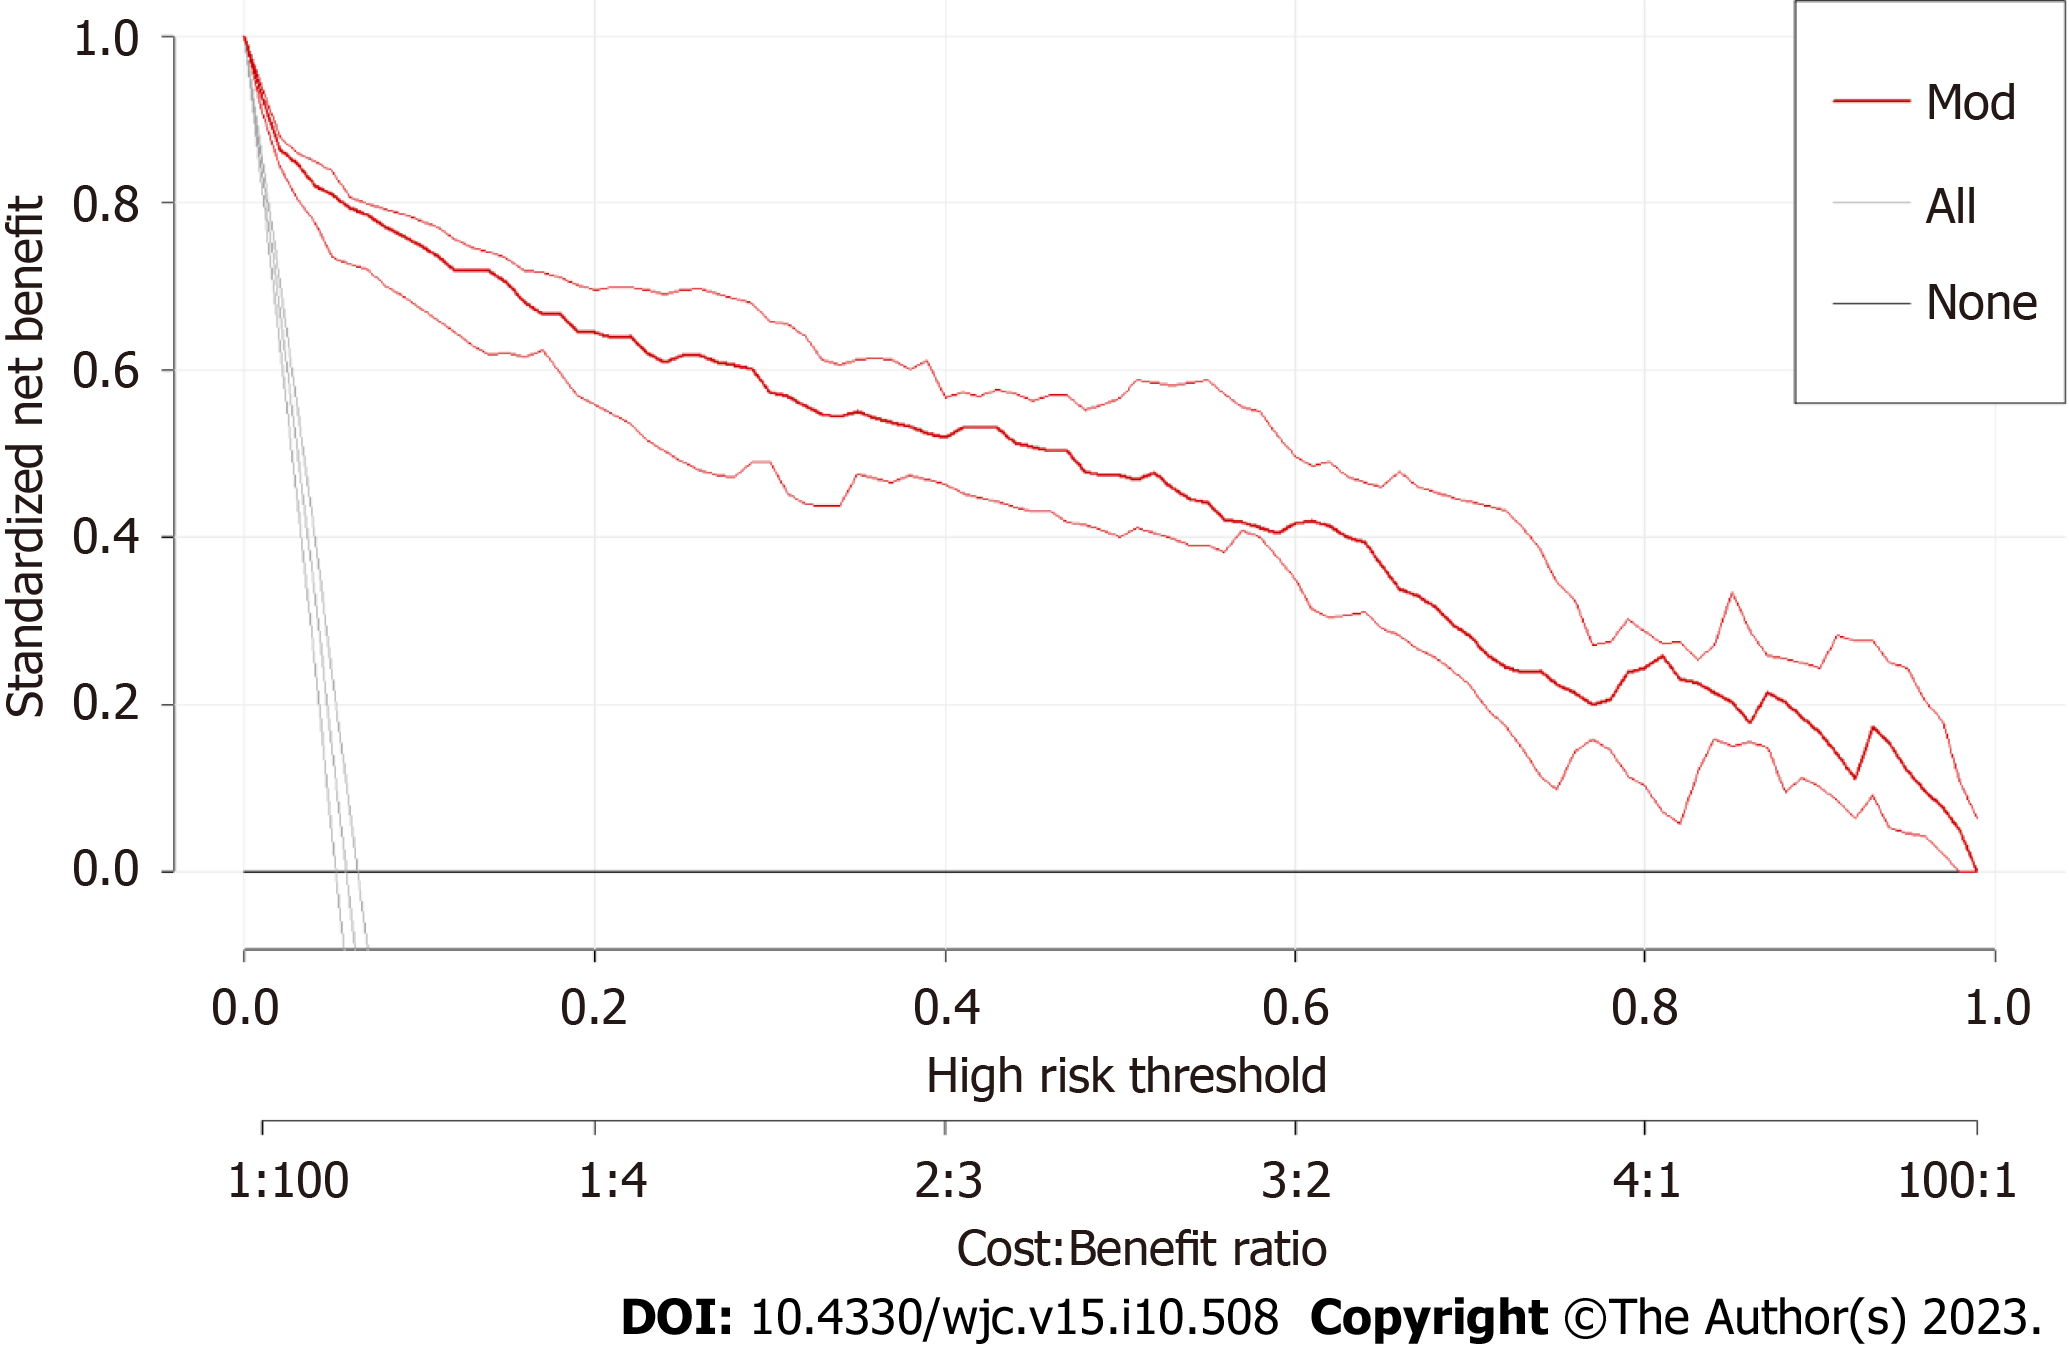
Figure 5 Decision curve analysis of the prehospital return of spontaneous circulation model.
The X- and Y-axes show the threshold probabilities and net benefits, respectively. The solid red line indicates the prehospital return of spontaneous circulation model. The “All” and “None” lines represent interventions for all or none of the patients, respectively.
- Citation: Wang JJ, Zhou Q, Huang ZH, Han Y, Qin CZ, Chen ZQ, Xiao XY, Deng Z. Establishment of a prediction model for prehospital return of spontaneous circulation in out-of-hospital patients with cardiac arrest. World J Cardiol 2023; 15(10): 508-517
- URL: https://www.wjgnet.com/1949-8462/full/v15/i10/508.htm
- DOI: https://dx.doi.org/10.4330/wjc.v15.i10.508


