Copyright
©The Author(s) 2022.
World J Cardiol. Jul 26, 2022; 14(7): 427-437
Published online Jul 26, 2022. doi: 10.4330/wjc.v14.i7.427
Published online Jul 26, 2022. doi: 10.4330/wjc.v14.i7.427
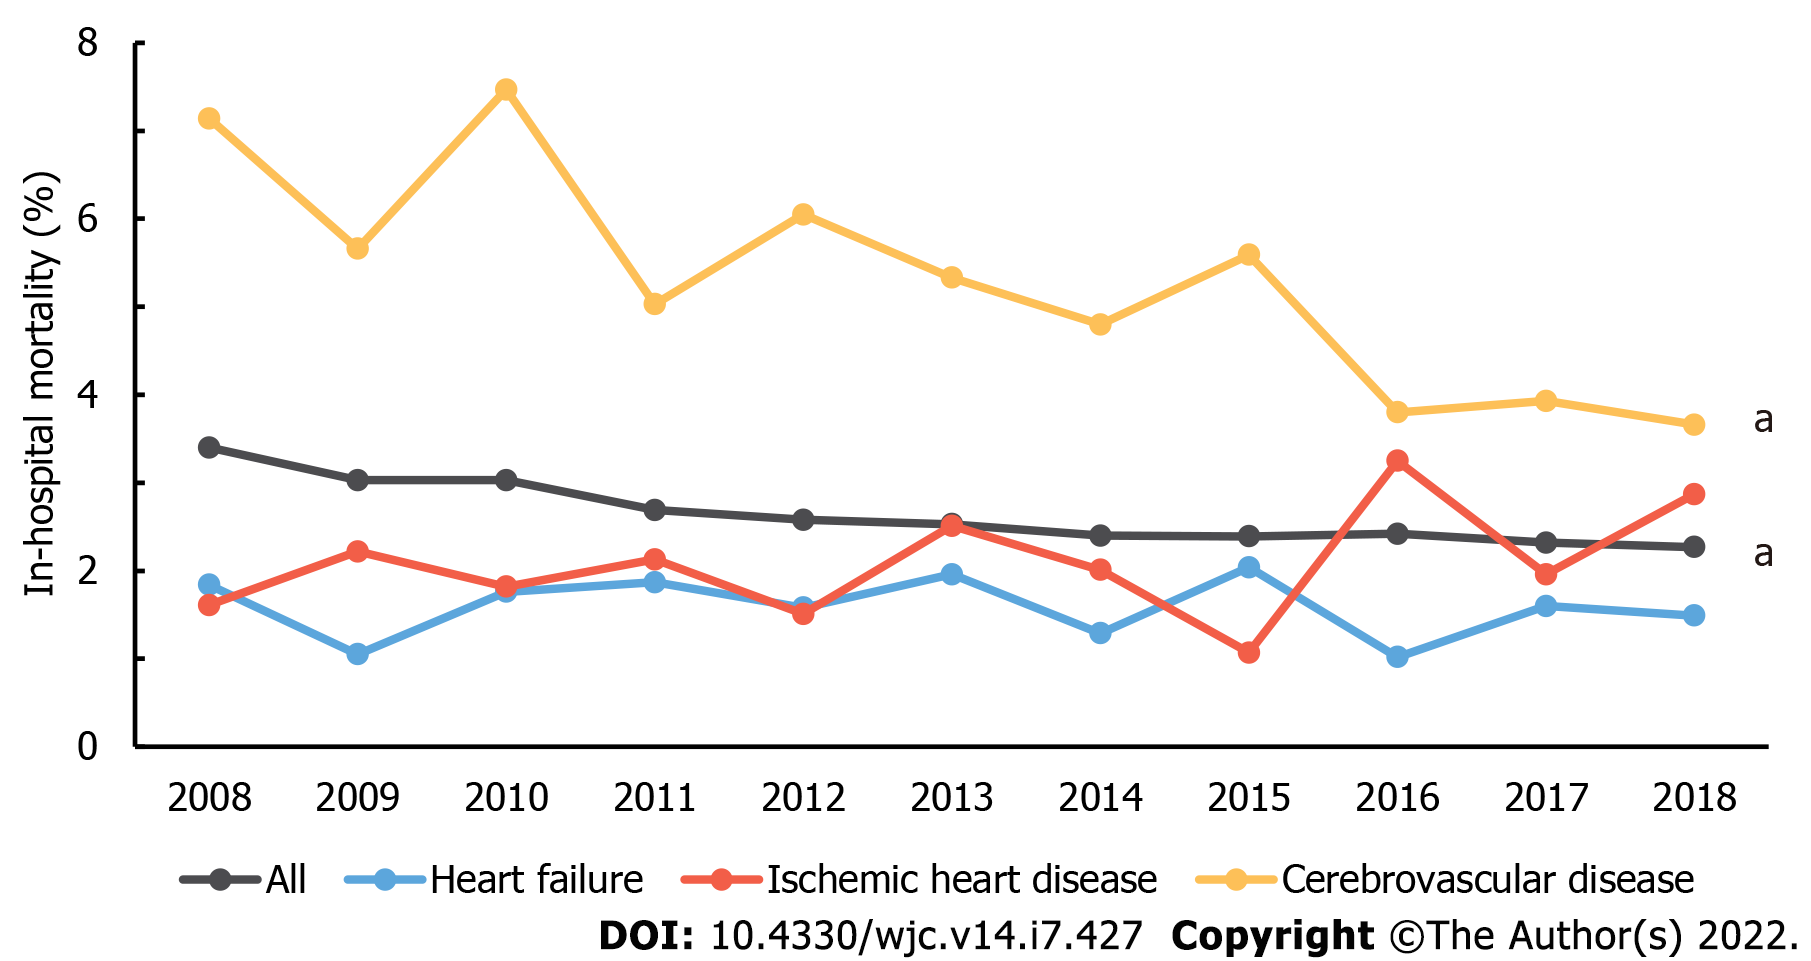
Figure 3 Yearly trend of average in-hospital mortality rate in admissions due to heart failure and other cardiovascular diseases in people living with human immunodeficiency virus.
Line graphs illustrate the trend of in-hospital mortality in all admissions due to heart failure (blue), ischemic heart disease (red), and cerebrovascular disease (yellow). Gray line shows the in-hospital mortality of all admissions occurring in people living with human immunodeficiency virus. Significant Ptrend < 0.05 is marked with an asterisk (a) at the end of the linear graph.
- Citation: Park DY, An S, Romero ME, Murthi M, Atluri R. National trend of heart failure and other cardiovascular diseases in people living with human immunodeficiency virus. World J Cardiol 2022; 14(7): 427-437
- URL: https://www.wjgnet.com/1949-8462/full/v14/i7/427.htm
- DOI: https://dx.doi.org/10.4330/wjc.v14.i7.427


