Copyright
©The Author(s) 2022.
World J Cardiol. Jul 26, 2022; 14(7): 411-426
Published online Jul 26, 2022. doi: 10.4330/wjc.v14.i7.411
Published online Jul 26, 2022. doi: 10.4330/wjc.v14.i7.411
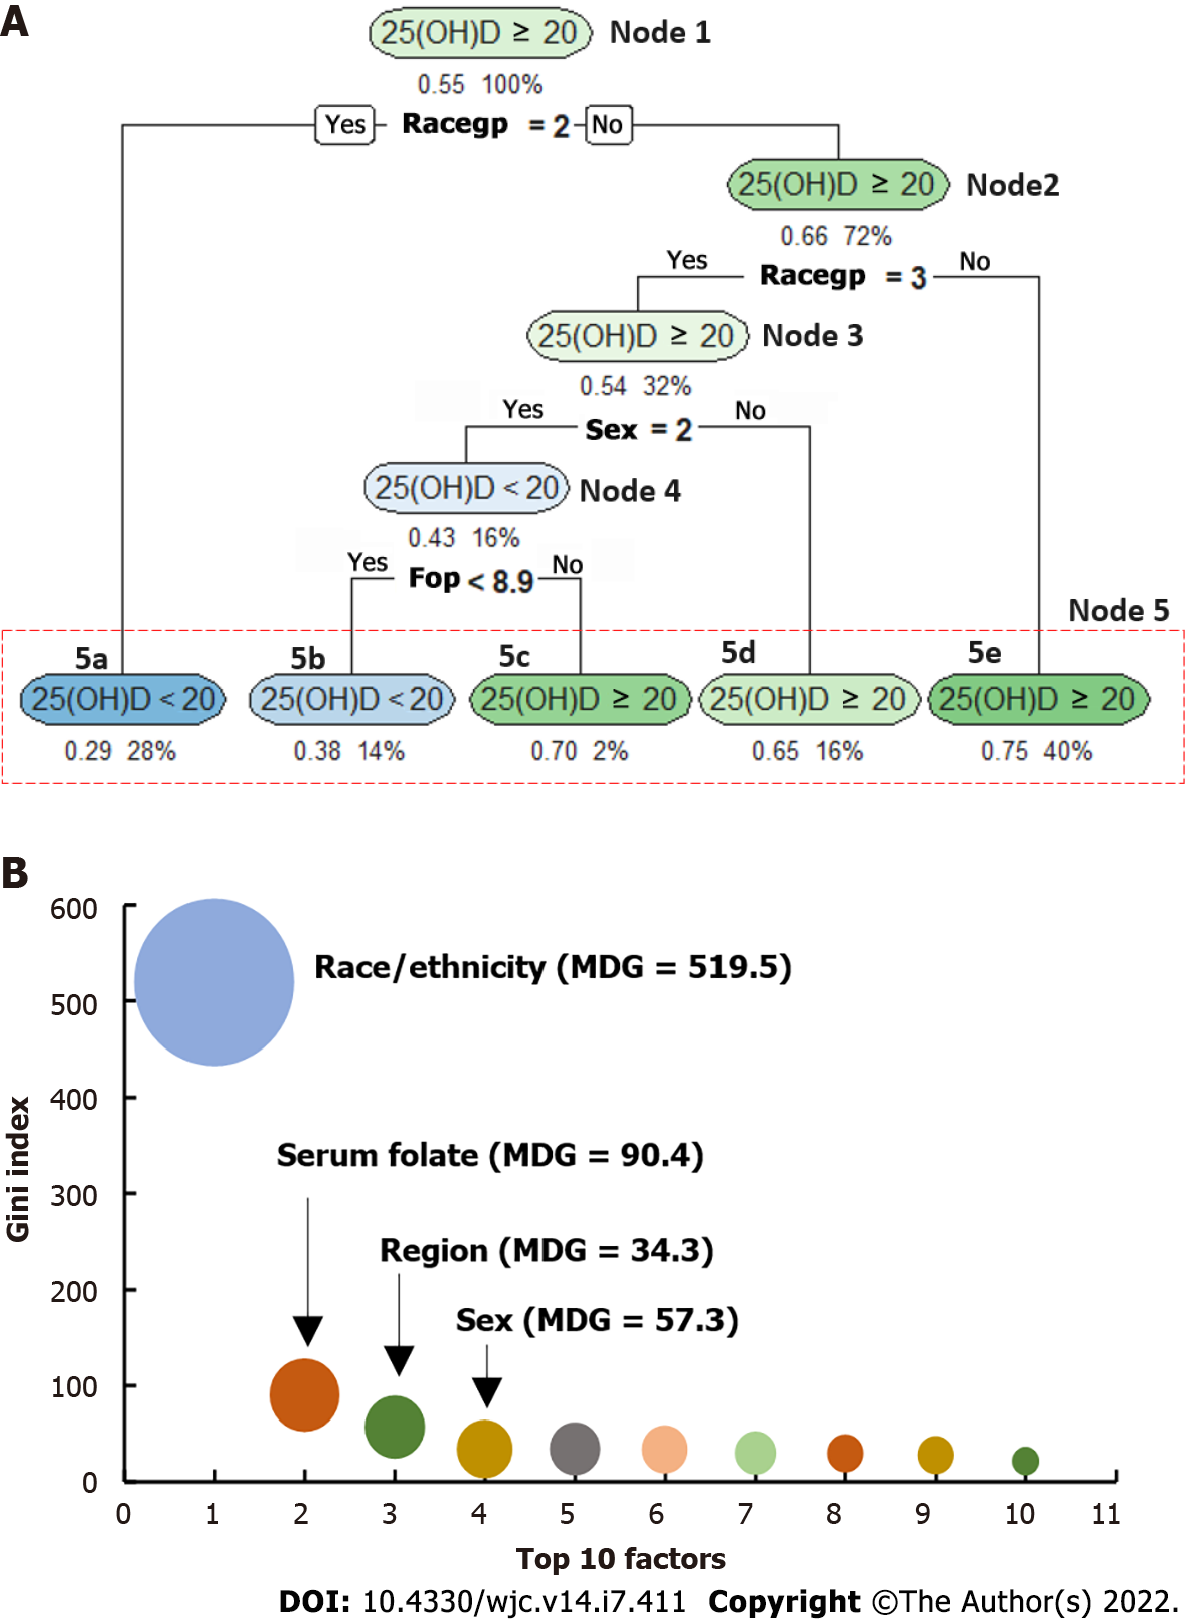
Figure 3 Example of classification and regression trees with serum 25 hydroxyvitamin D ≥ 20 vs < 20 ng/dL in both sexes.
A: Decision tree. Node 1: is the “root” node. Nodes 2 to 5 are the “leaves”. Node 5 is also called as the terminal node, including five sub-nodes (5a – 5e). Each “leaf” is a classification labeled for the output variable {serum 25-hydroxyvitamin D [25(OH)D]}, showing in each oval-shaped box. Under each box, the values listed on right indicates the % of total sample size, and the value listed on the left indicates the % of those with serum 25(OH)D concentration ≥ 20 ng/mL. If the value on the left-listed is > 0.5 then the corresponding oval-shaped box is labeled as 25(OH) ≥ 20 ng/mL, otherwise labeled as < 20 ng/mL; B: An example of top 10 important variables presented by their mean decrease in Gini (MDG) index, a higher MDG indicates a stronger predictor for the output variable. 25(OH)D: 25-hydroxyvitamin D; RACEGP: Race group, coded as racegp = 1 for non-Hispanic White, racegp = 2 for non-Hispanic Black, and racegp = 3 for all the other race groups; Sex = 1 for male, and sex = 2 for female; FOP: Serum folate level; MDG: Mean decrease in Gini index.
- Citation: Liu L, Cui S, Volpe SL, May NS, Sukumar D, DiMaria-Ghalili RA, Eisen HJ. Vitamin d deficiency and metabolic syndrome: The joint effect on cardiovascular and all-cause mortality in the United States adults . World J Cardiol 2022; 14(7): 411-426
- URL: https://www.wjgnet.com/1949-8462/full/v14/i7/411.htm
- DOI: https://dx.doi.org/10.4330/wjc.v14.i7.411


