Copyright
©The Author(s) 2022.
World J Cardiol. May 26, 2022; 14(5): 282-296
Published online May 26, 2022. doi: 10.4330/wjc.v14.i5.282
Published online May 26, 2022. doi: 10.4330/wjc.v14.i5.282
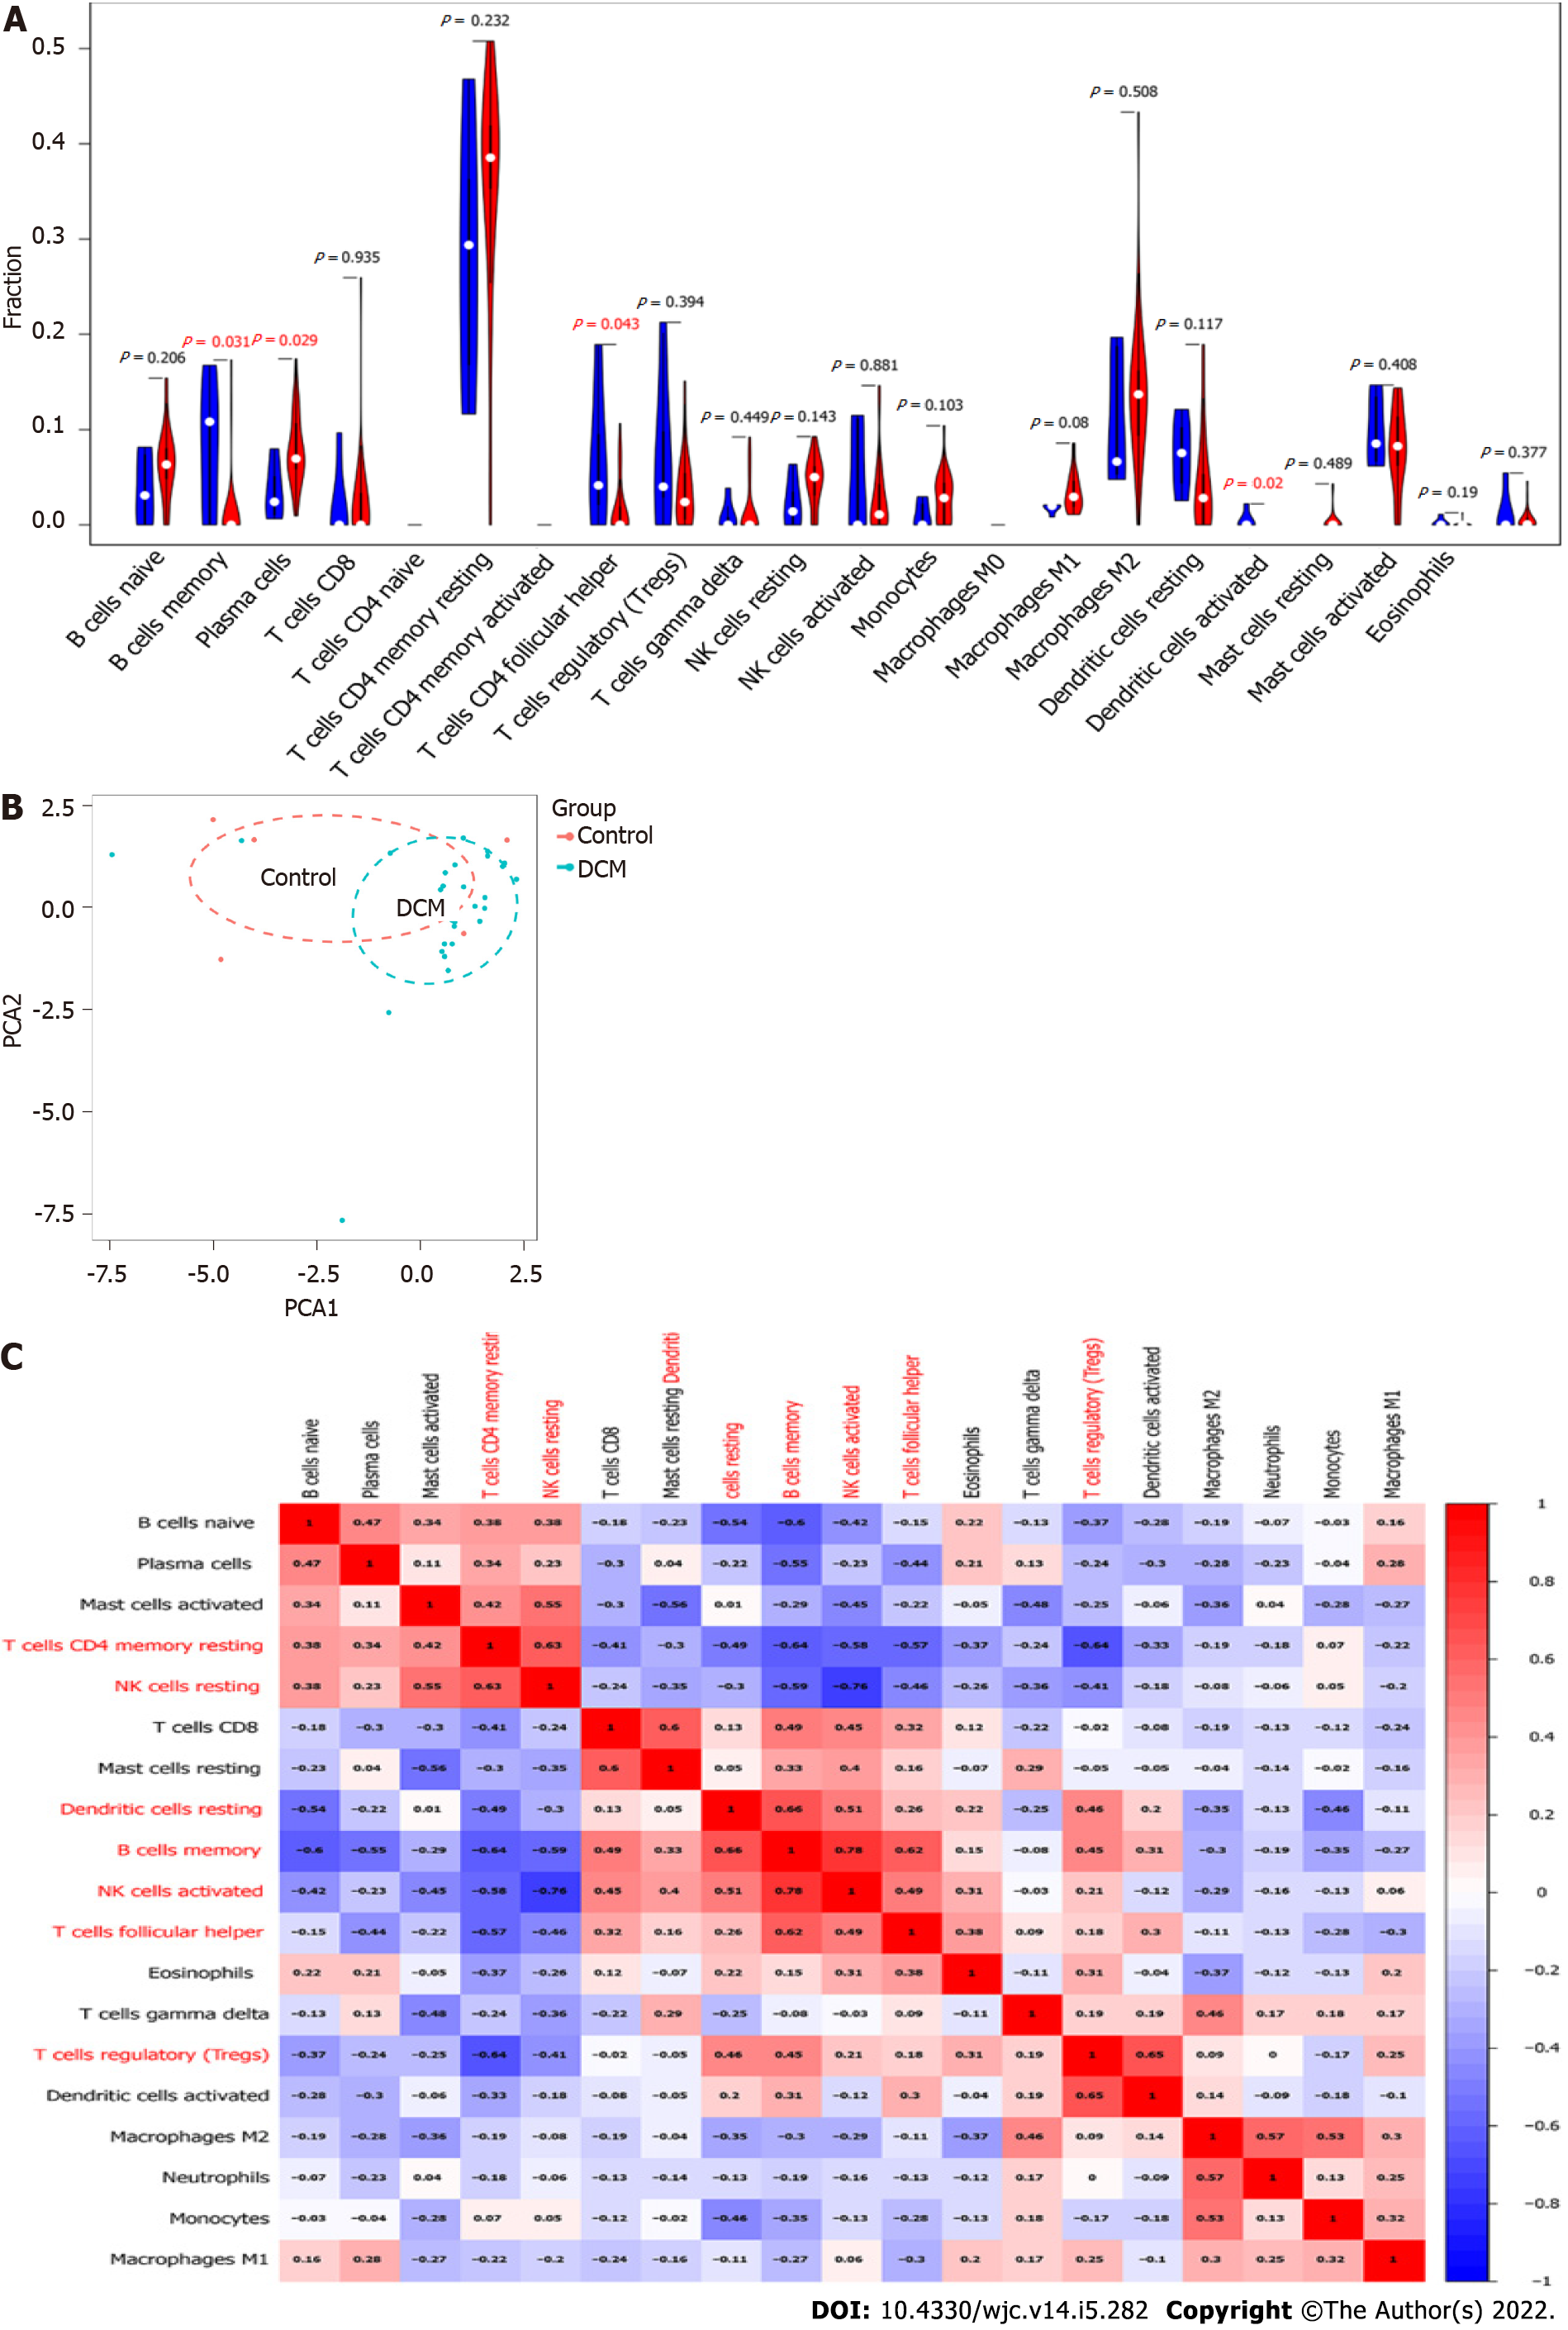
Figure 6 Immune cell infiltration analyses of differentially expressed genes.
A: Violin plot, in which red represents dilated cardiomyopathy group and blue represents the normal group; B: Principal component analysis; C: Correlation heatmap.
- Citation: Liu Z, Song YN, Chen KY, Gao WL, Chen HJ, Liang GY. Bioinformatics prediction of potential mechanisms and biomarkers underlying dilated cardiomyopathy. World J Cardiol 2022; 14(5): 282-296
- URL: https://www.wjgnet.com/1949-8462/full/v14/i5/282.htm
- DOI: https://dx.doi.org/10.4330/wjc.v14.i5.282


