Copyright
©The Author(s) 2022.
World J Cardiol. May 26, 2022; 14(5): 282-296
Published online May 26, 2022. doi: 10.4330/wjc.v14.i5.282
Published online May 26, 2022. doi: 10.4330/wjc.v14.i5.282
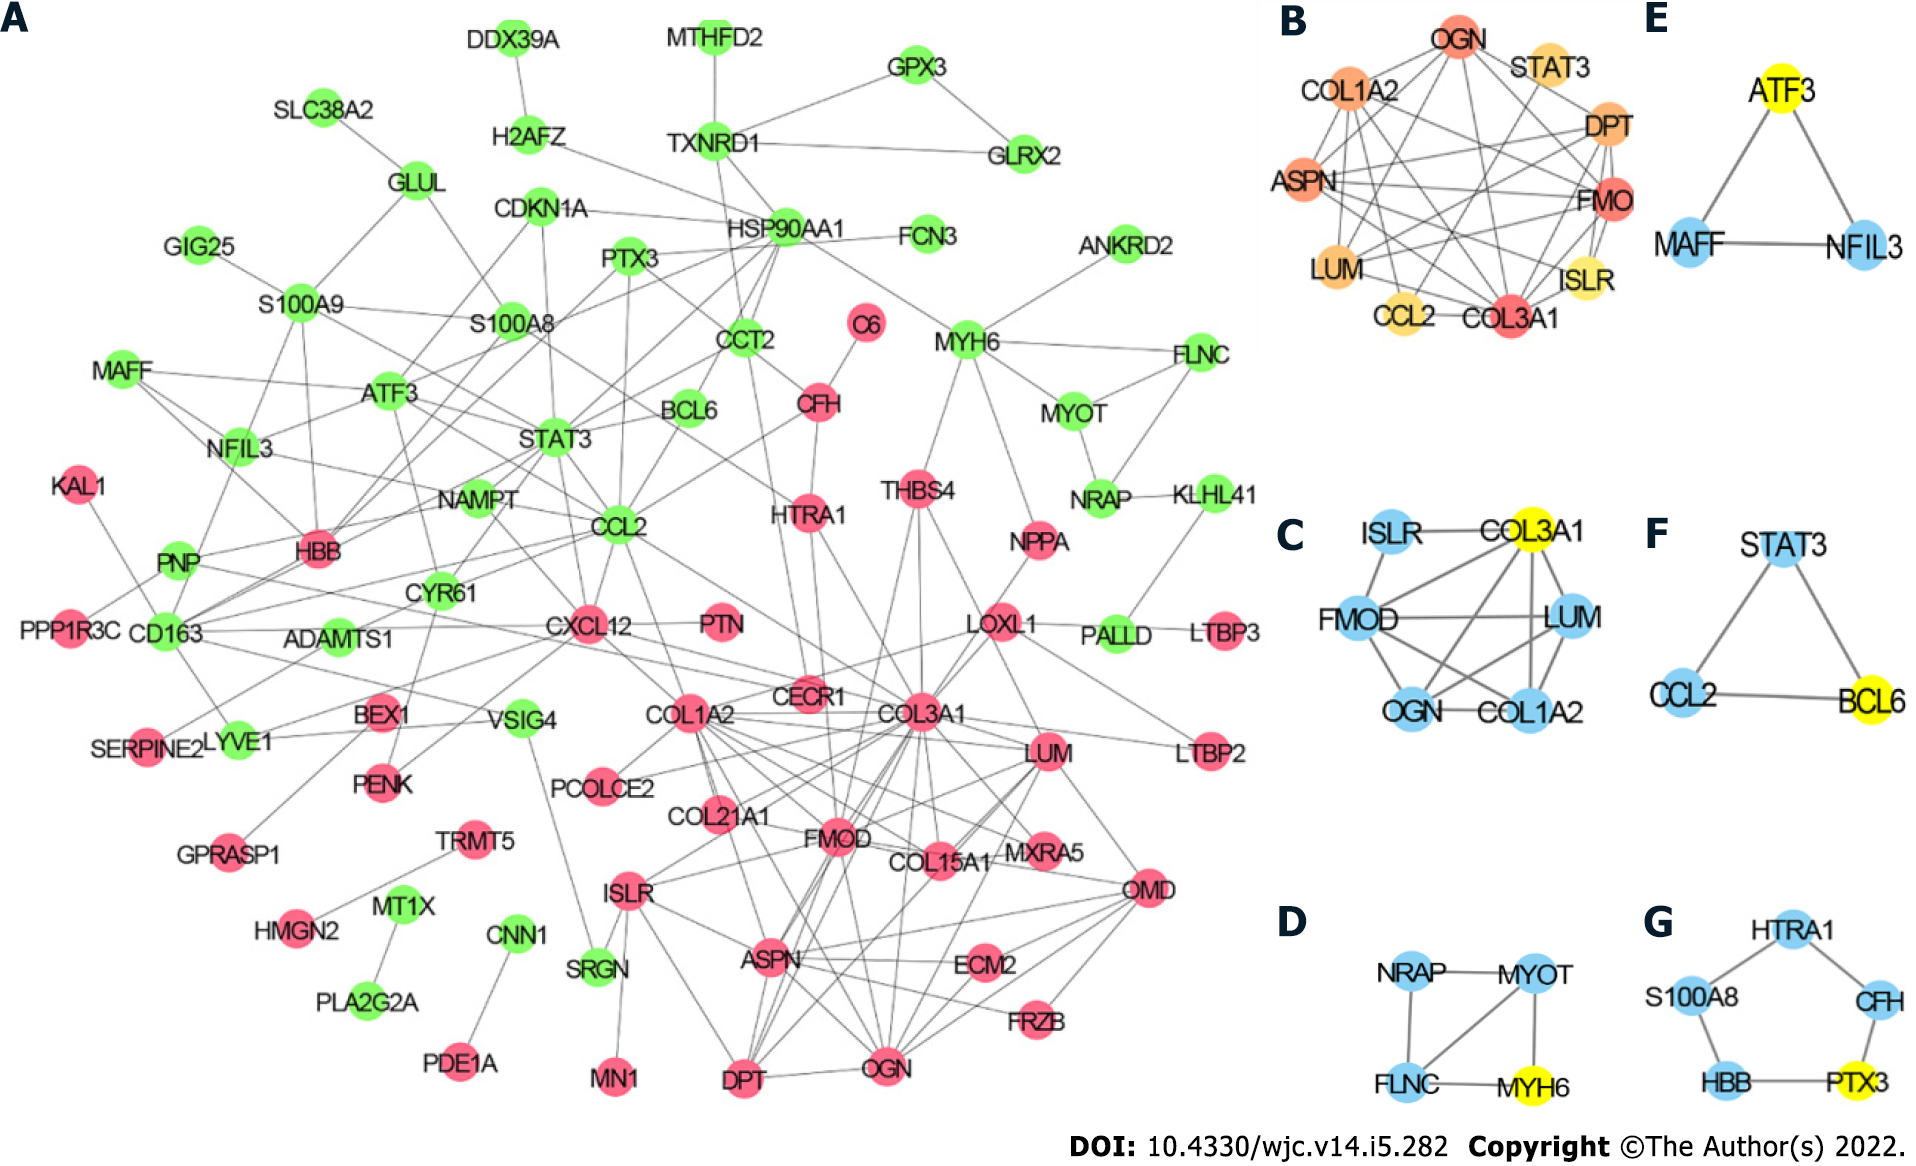
Figure 4 Protein-protein interaction network.
A: Protein-protein interaction (PPI) network of differentially expressed genes (DEGs), in which the red node represents upregulated DEGs and the green node represents the downregulated DEGs; B: Top 10 hub genes; C: Module 1; D: Module 2; E: Module 3; F: Module 4; G: Module 5. Yellow node represents the Seed gene of each module.
- Citation: Liu Z, Song YN, Chen KY, Gao WL, Chen HJ, Liang GY. Bioinformatics prediction of potential mechanisms and biomarkers underlying dilated cardiomyopathy. World J Cardiol 2022; 14(5): 282-296
- URL: https://www.wjgnet.com/1949-8462/full/v14/i5/282.htm
- DOI: https://dx.doi.org/10.4330/wjc.v14.i5.282


