Copyright
©The Author(s) 2021.
World J Cardiol. Dec 26, 2021; 13(12): 733-744
Published online Dec 26, 2021. doi: 10.4330/wjc.v13.i12.733
Published online Dec 26, 2021. doi: 10.4330/wjc.v13.i12.733
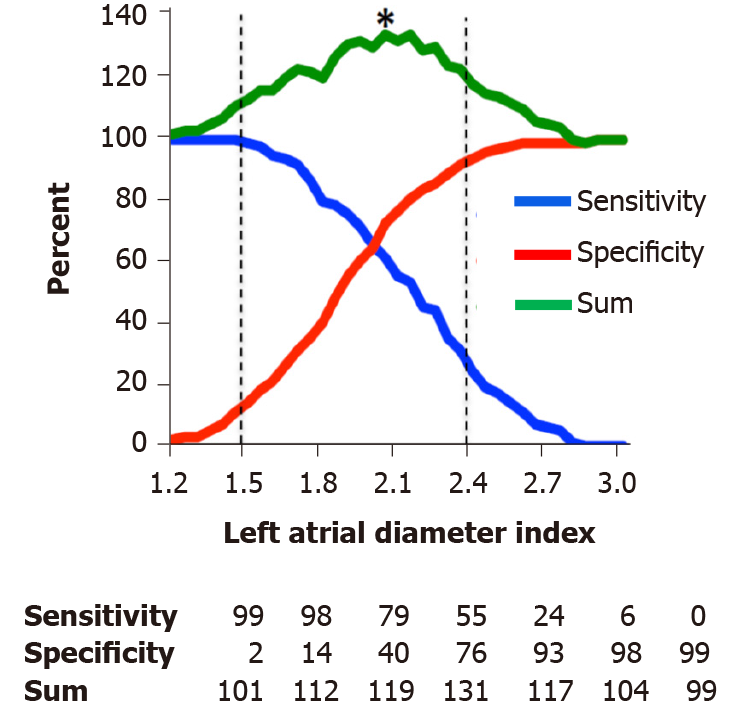
Figure 1 Comparison of sensitivity and specificity of left atrial diameter index cut-points.
Sensitivity, specificity, and the summation of sensitivity and specificity are plotted for left atrial diameter index at 0.05 cm/m2 intervals. Sensitivity is shown in blue, specificity is shown in red, and the summation of the two is shown in green. The reference upper and lower limits of normal (2.4 cm/m2 and 1.5 cm/m2, respectively) are indicated with dashed lines. The optimal cut-point that maximizes sensitivity and specificity was 2.05 cm/m2 and is indicated with an asterisk (*) on the graph.
- Citation: Khemka A, Sutter DA, Habhab MN, Thomaides A, Hornsby K, Feigenbaum H, Sawada SG. Prognostic value of left atrial size in hypertensive African Americans undergoing stress echocardiography. World J Cardiol 2021; 13(12): 733-744
- URL: https://www.wjgnet.com/1949-8462/full/v13/i12/733.htm
- DOI: https://dx.doi.org/10.4330/wjc.v13.i12.733


